As a manufacturing company, we are routinely analyzing the embodied energy of the products we make. We have Emon sensors installed on all of our machinery and equipment and are using EmonCMS to log and graph. Frequently we have the need to look at how much energy a specific operation required or even just what we used that afternoon. The Wh logging functionality is very handy, but to pull out specific moments requires cutting and pasting values and using a calculator to determine how much energy was used in a given time span.
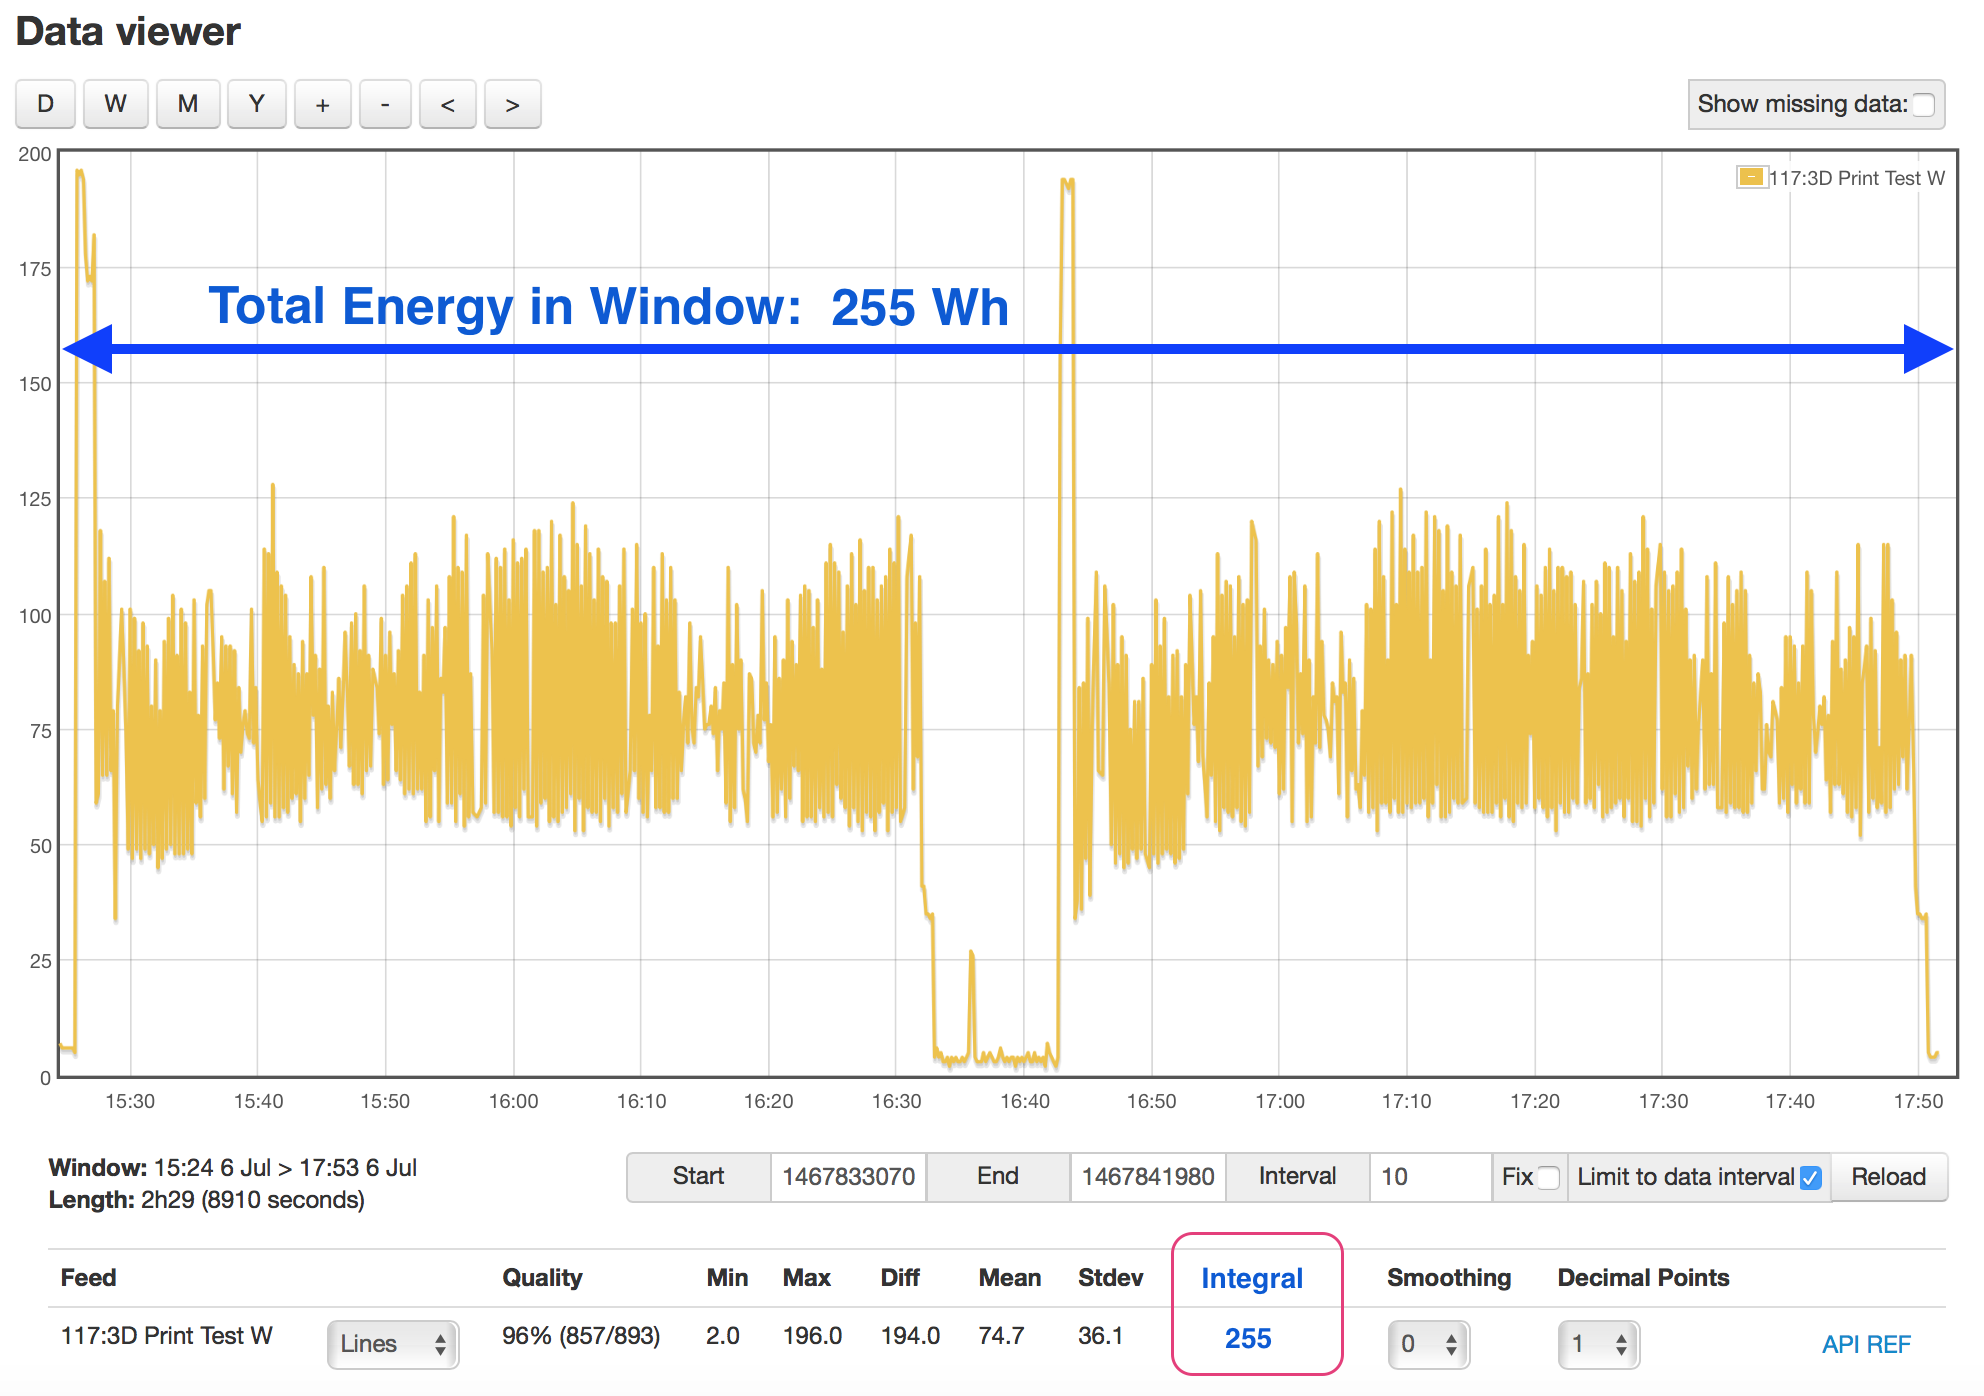
In one of the current visualizations there is displayed below the graph some very useful figures: quality, min, max, mean, and std deviations. It would be extremely useful for the statistics to show how much energy is displayed in the current window assuming that the source is watts. We are interested in developing this functionality ourselves but could use some guidance for a starting point.
How do we go about modifying the GRAPH visualization to display the energy integral expressed as Wh?
(mean power in watts x time_in_window in seconds) / 3600 Joules in 1 watt hour

out += "<td>"+((feedlist[z].stats.mean * time_in_window) / 3600).toFixed(dp)+"</td>";
Looking to implement these changes now and came across a question. Where are these files located on the EmonPi? We installed using the pre-built image.
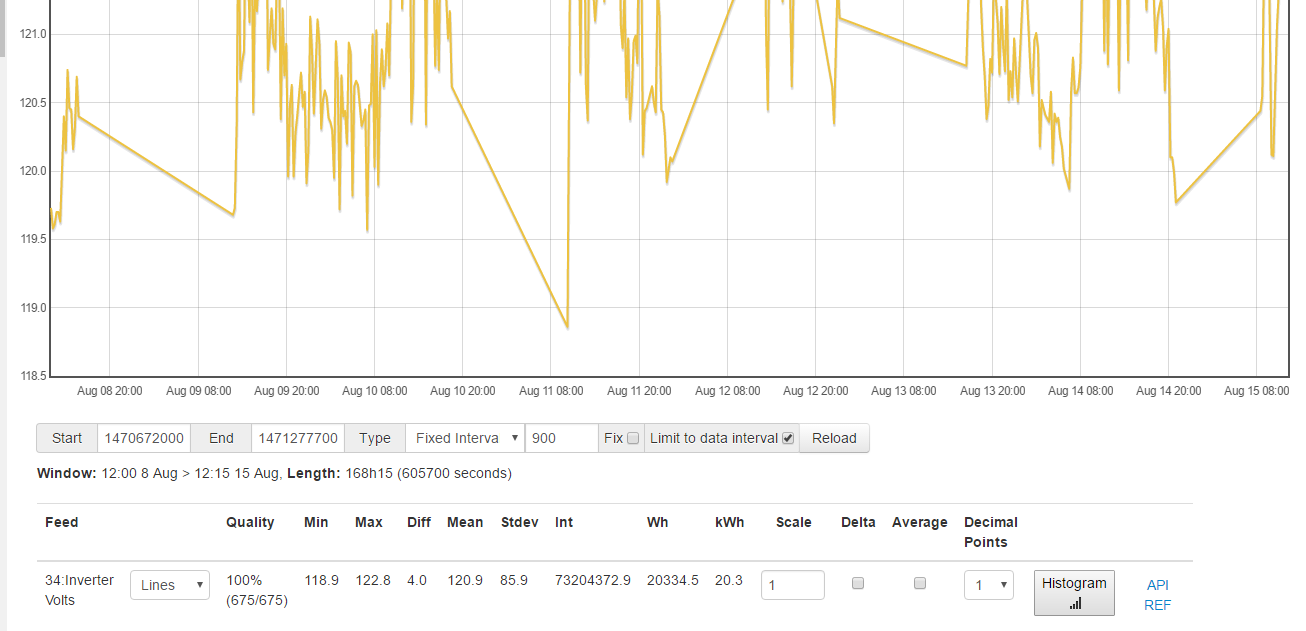
That did it graph2.js is there now. Made the changes and also added some other stuff. For now it’s up to the user to decide what the “Int” value means, and whether or not the “Wh” and “kWh” values are relevant or not.
Starting at line 491 in graph2.js out += "<td>"+feedlist[z].stats.stdev.toFixed(dp)+"</td>"; out += "<td>"+((feedlist[z].stats.mean * time_in_window)).toFixed(dp)+"</td>"; out += "<td>"+((feedlist[z].stats.mean * time_in_window) / 3600).toFixed(dp)+"</td>"; out += "<td>"+((feedlist[z].stats.mean * time_in_window) / 3600000).toFixed(dp)+"</td>"; for (var i=0; i<11; i++) out += "<option>"+i+"</option>";