I’ve benefited from all the hard work of everyone on this community and the tools themselves, hence want to give back some enhancements that I’ve been making.
I’ve been working on adding some extra capabilities to the control of multigraphs around allowing the user to select whether you see bars or lines and control the bar width for each series.
I’ve then tried to deal with defaults, to build upon existing saved multigraphs so that if nothing has been set and based some of this around what was already setup (e.g. using the datatype). I’ve also changed the mutligraph edit so that it only starts with the current level (basic) of settings and a radio to choose an advanced level.
For a stacked graph, the tooltip showed the height of the entry within the bar (i.e. including anything underneath it), hence have changed this to show just the data series height
An example of how this looks:
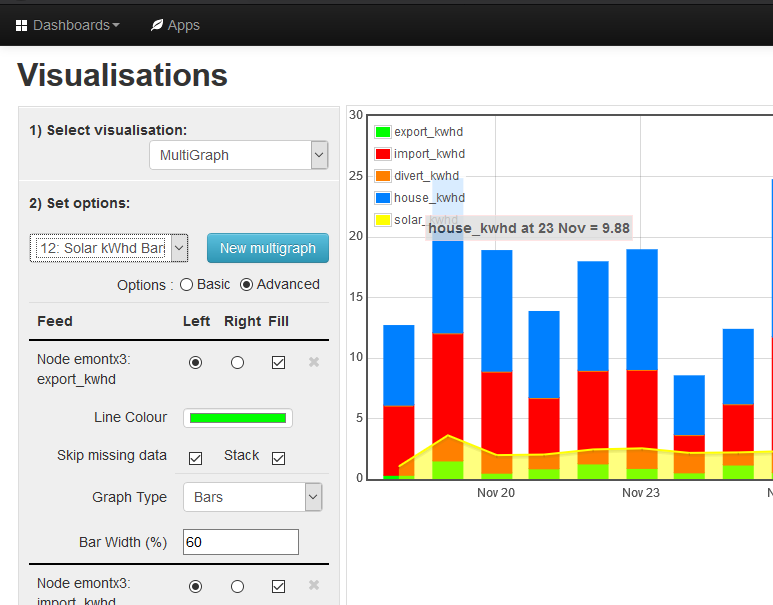
The example data is a little peculiar as I don’t have access to the data that I need, but will raise a separate topic to discuss this.
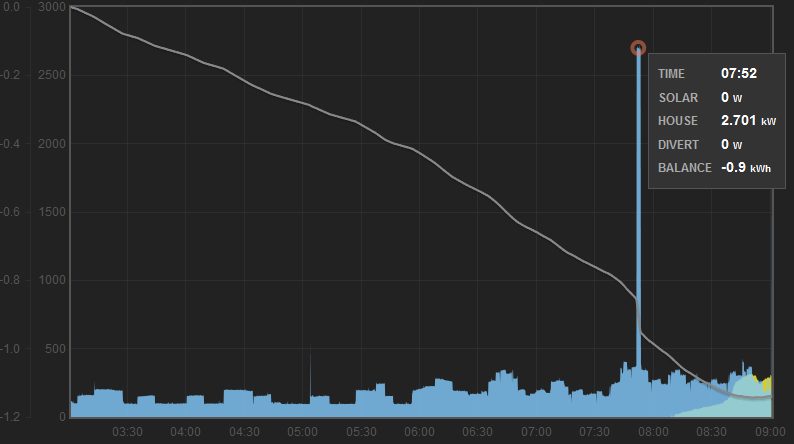
I realise that this should go in another part of the community, but have also changed mysolardivert app and tweaked the tooltip to show the unit as kWh for the Balance figure and then the show figures as kW when greater than 1,000 and removed the decimal places for the Watt measures. As below:
How can I feed this back as a candidate for you to hopefully then accept? I’m guessing this is via github, but as I’ve never used this before am unclear on how to use this and then how to propose my changes for your acceptance. Is there a short description already written that you can point me towards?
If you have conventions and approaches that I’m not following, then please let me know and I can tweak as appropriate.
 .
.


 and it looked like a welcome addition (although I had the same thoughts about moving options to advanced - as Glyn posted earlier).