Hi, Ive had my emonPi for a couple of months now and am very impressed. I have a question which I do feel is probably obvious but for the life of me I havent been able to solve it.
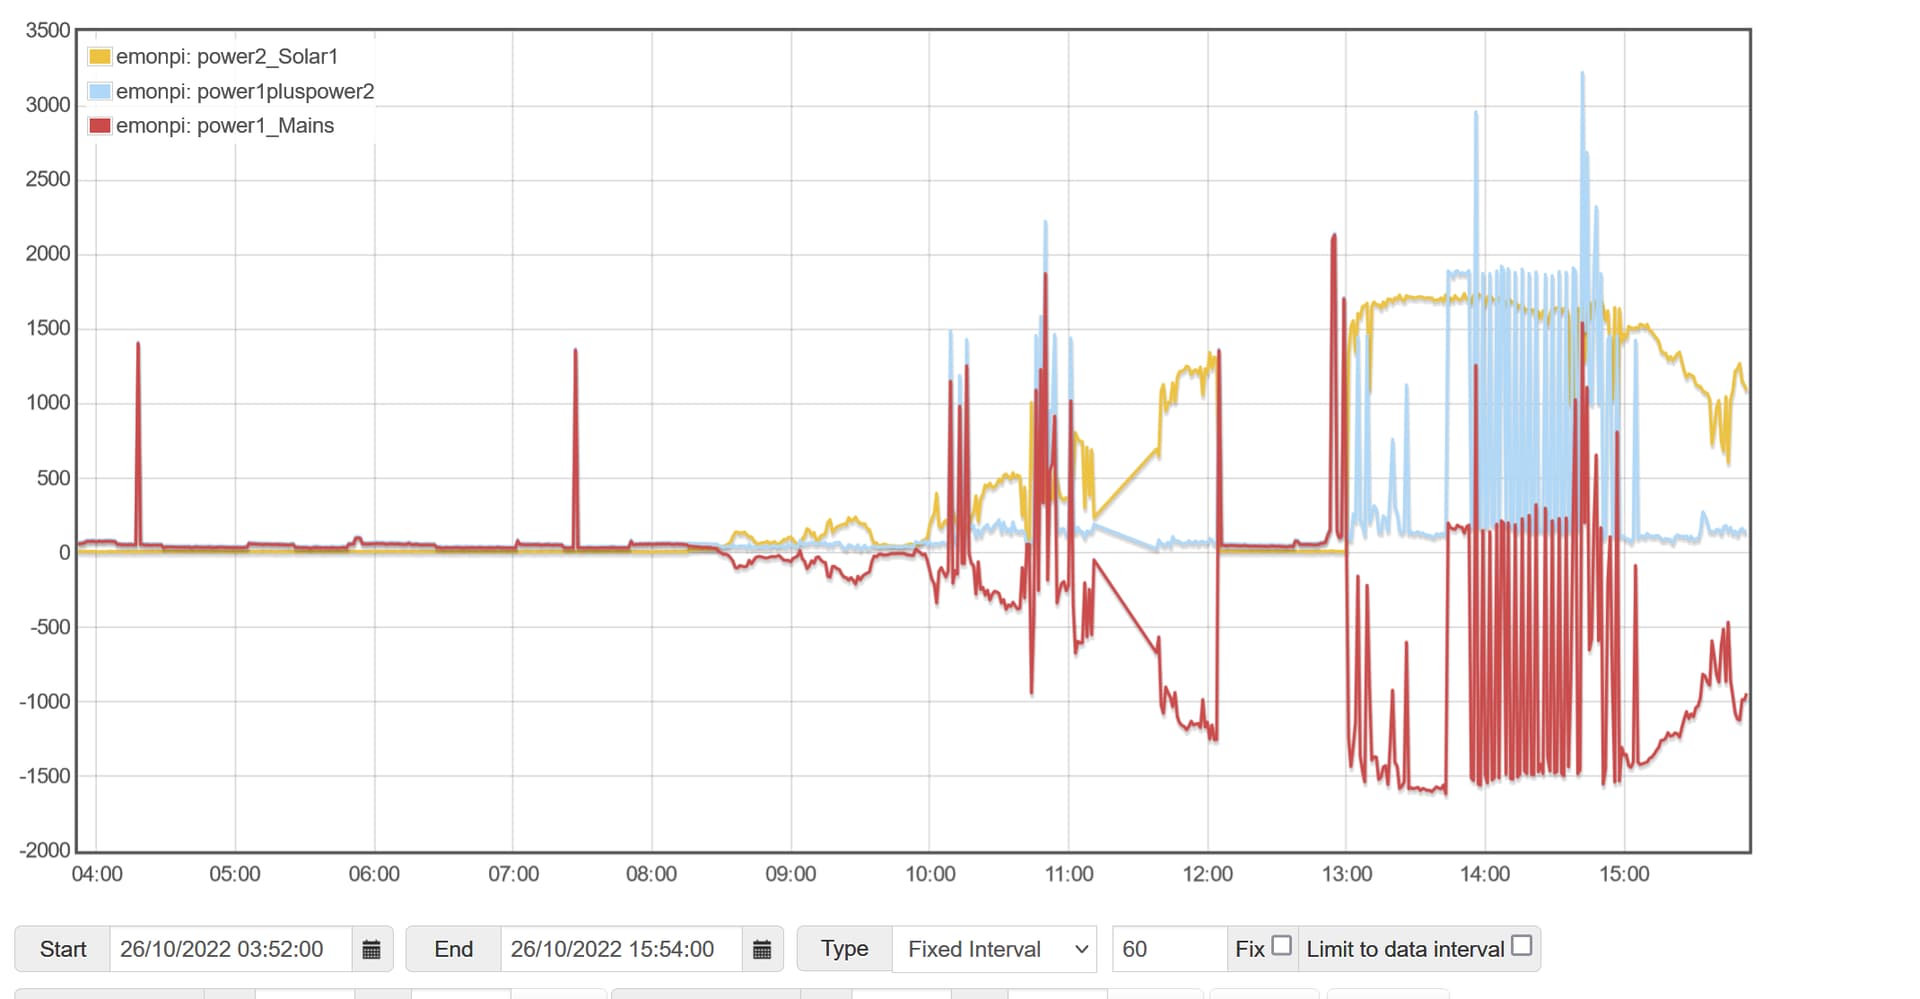
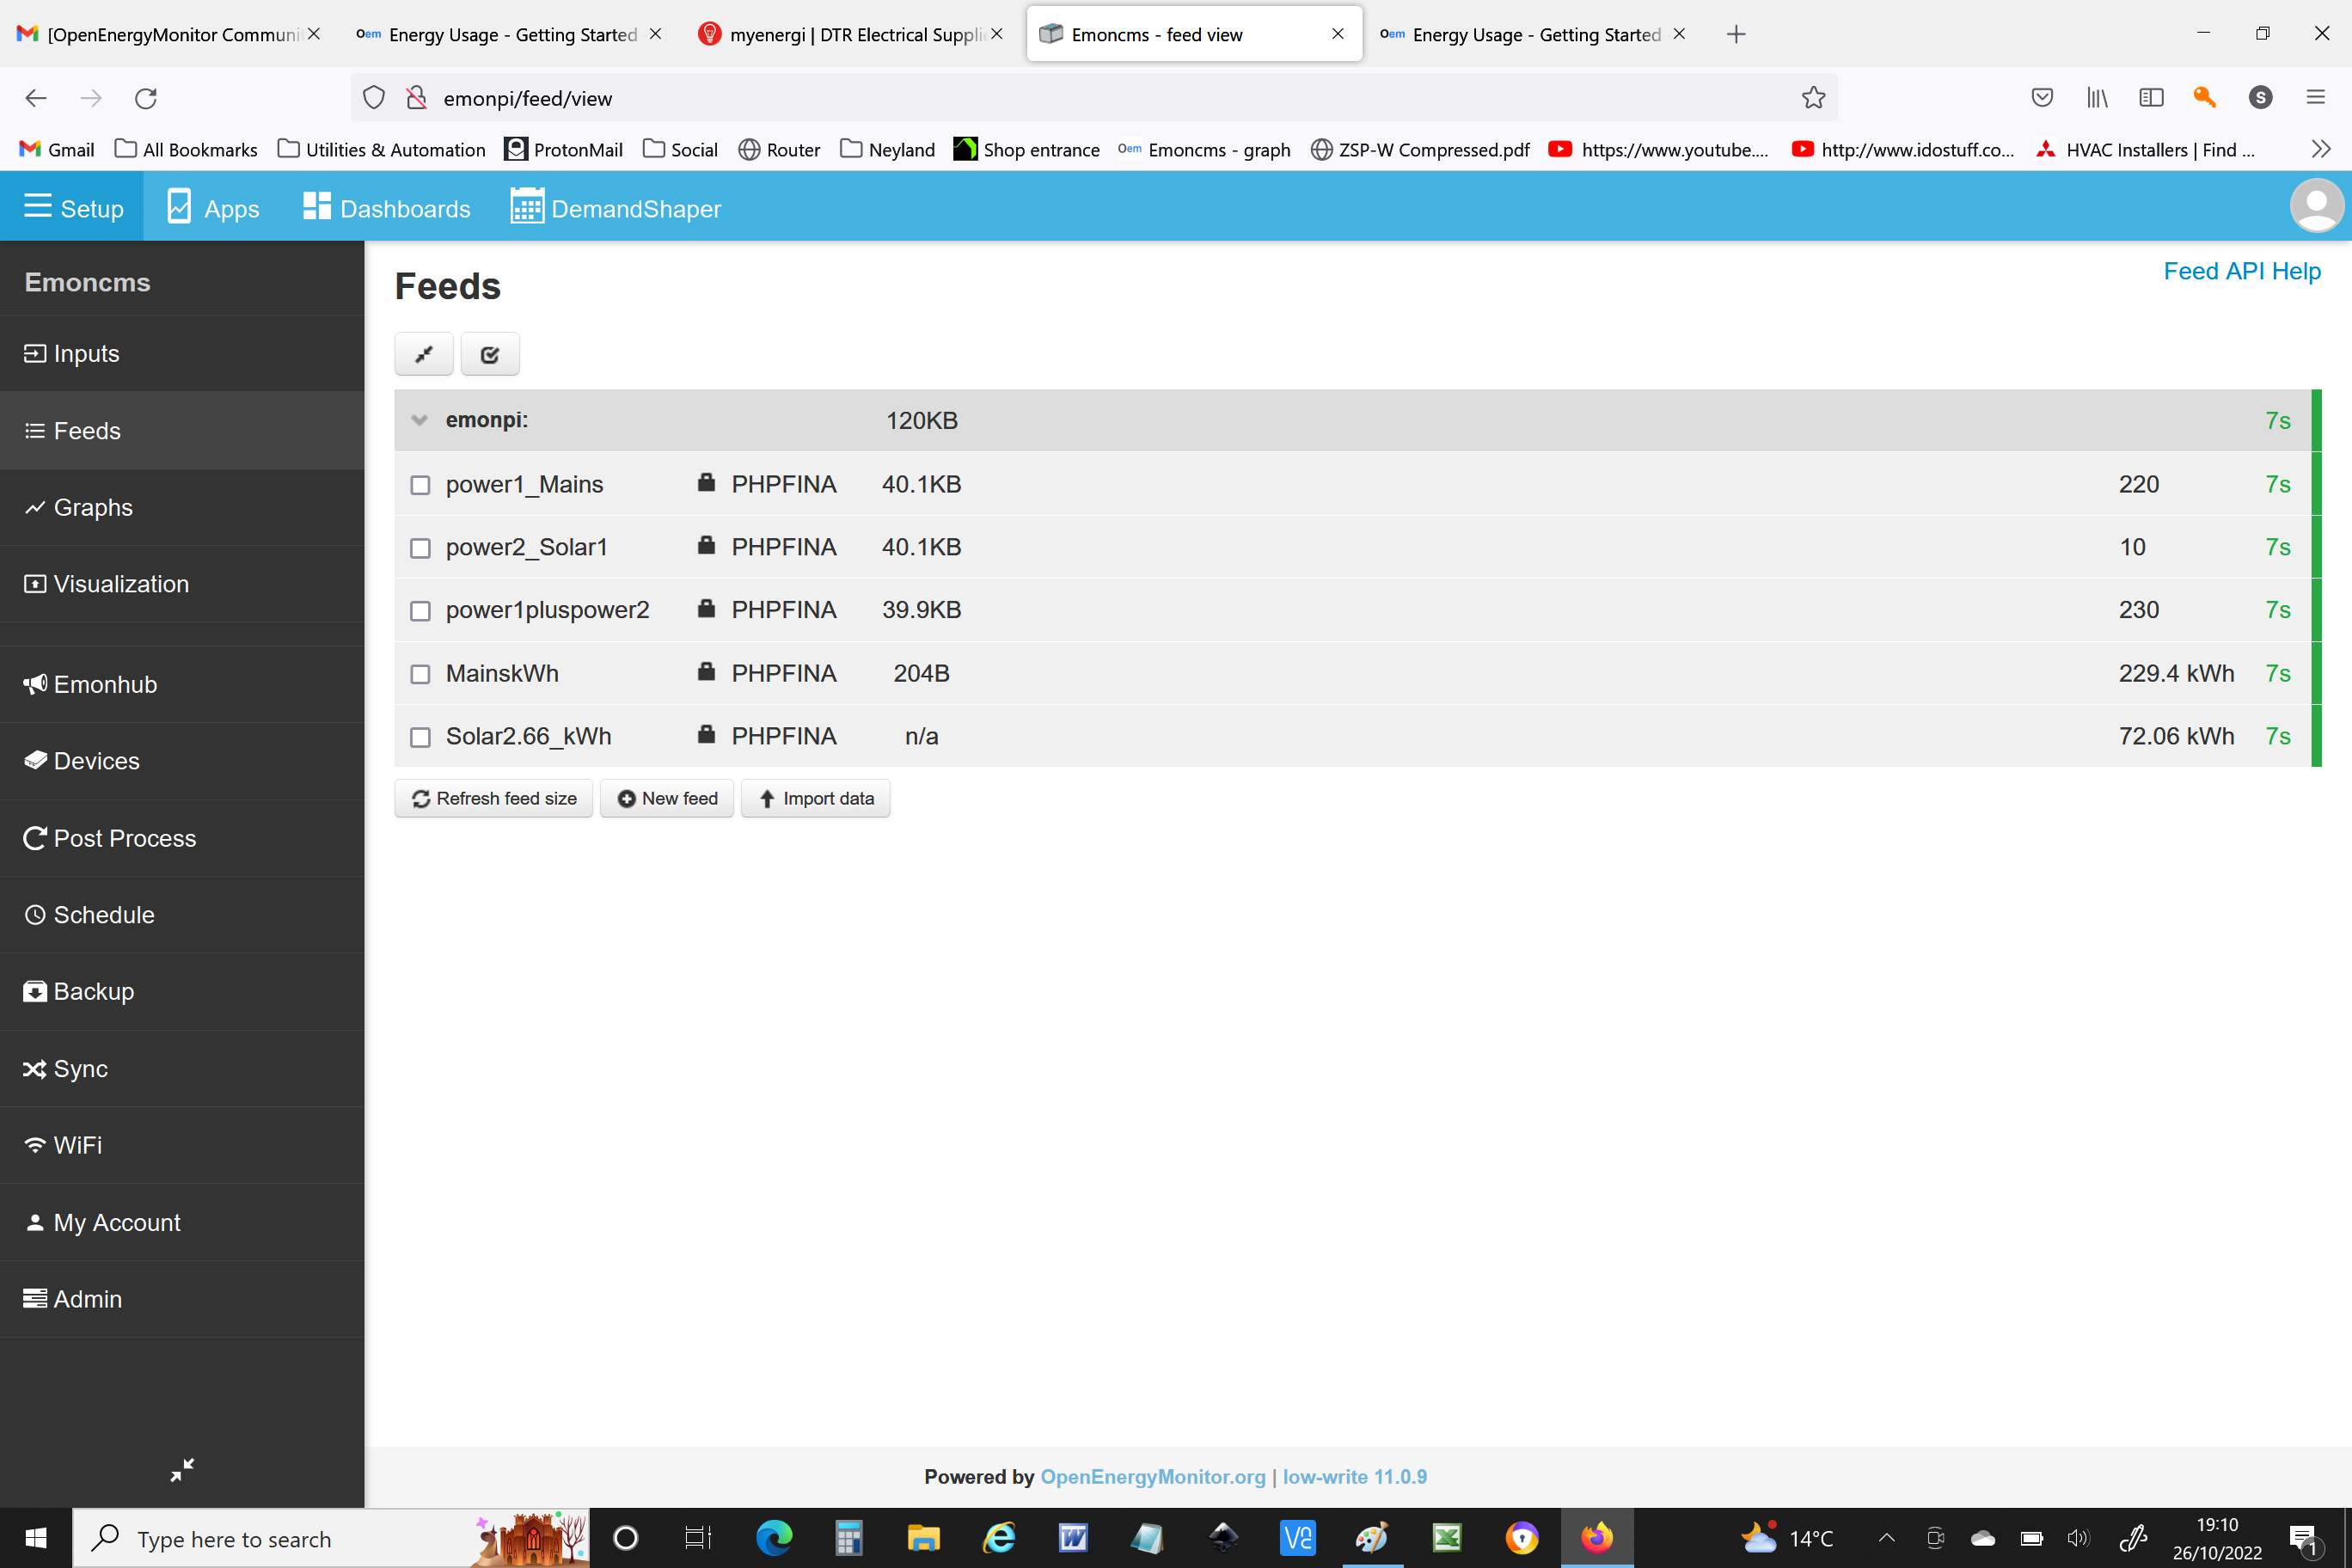
I have 3 feeds Power 1 which is my mains, Power 2 my solar and Power 1 + Power 2 which was created automatically. Ive managed to create kWh bar graphs with visualizations but what I want to do is create a bar graph of how many kWh I draw from the mains each day, which should tally with the smart meter.
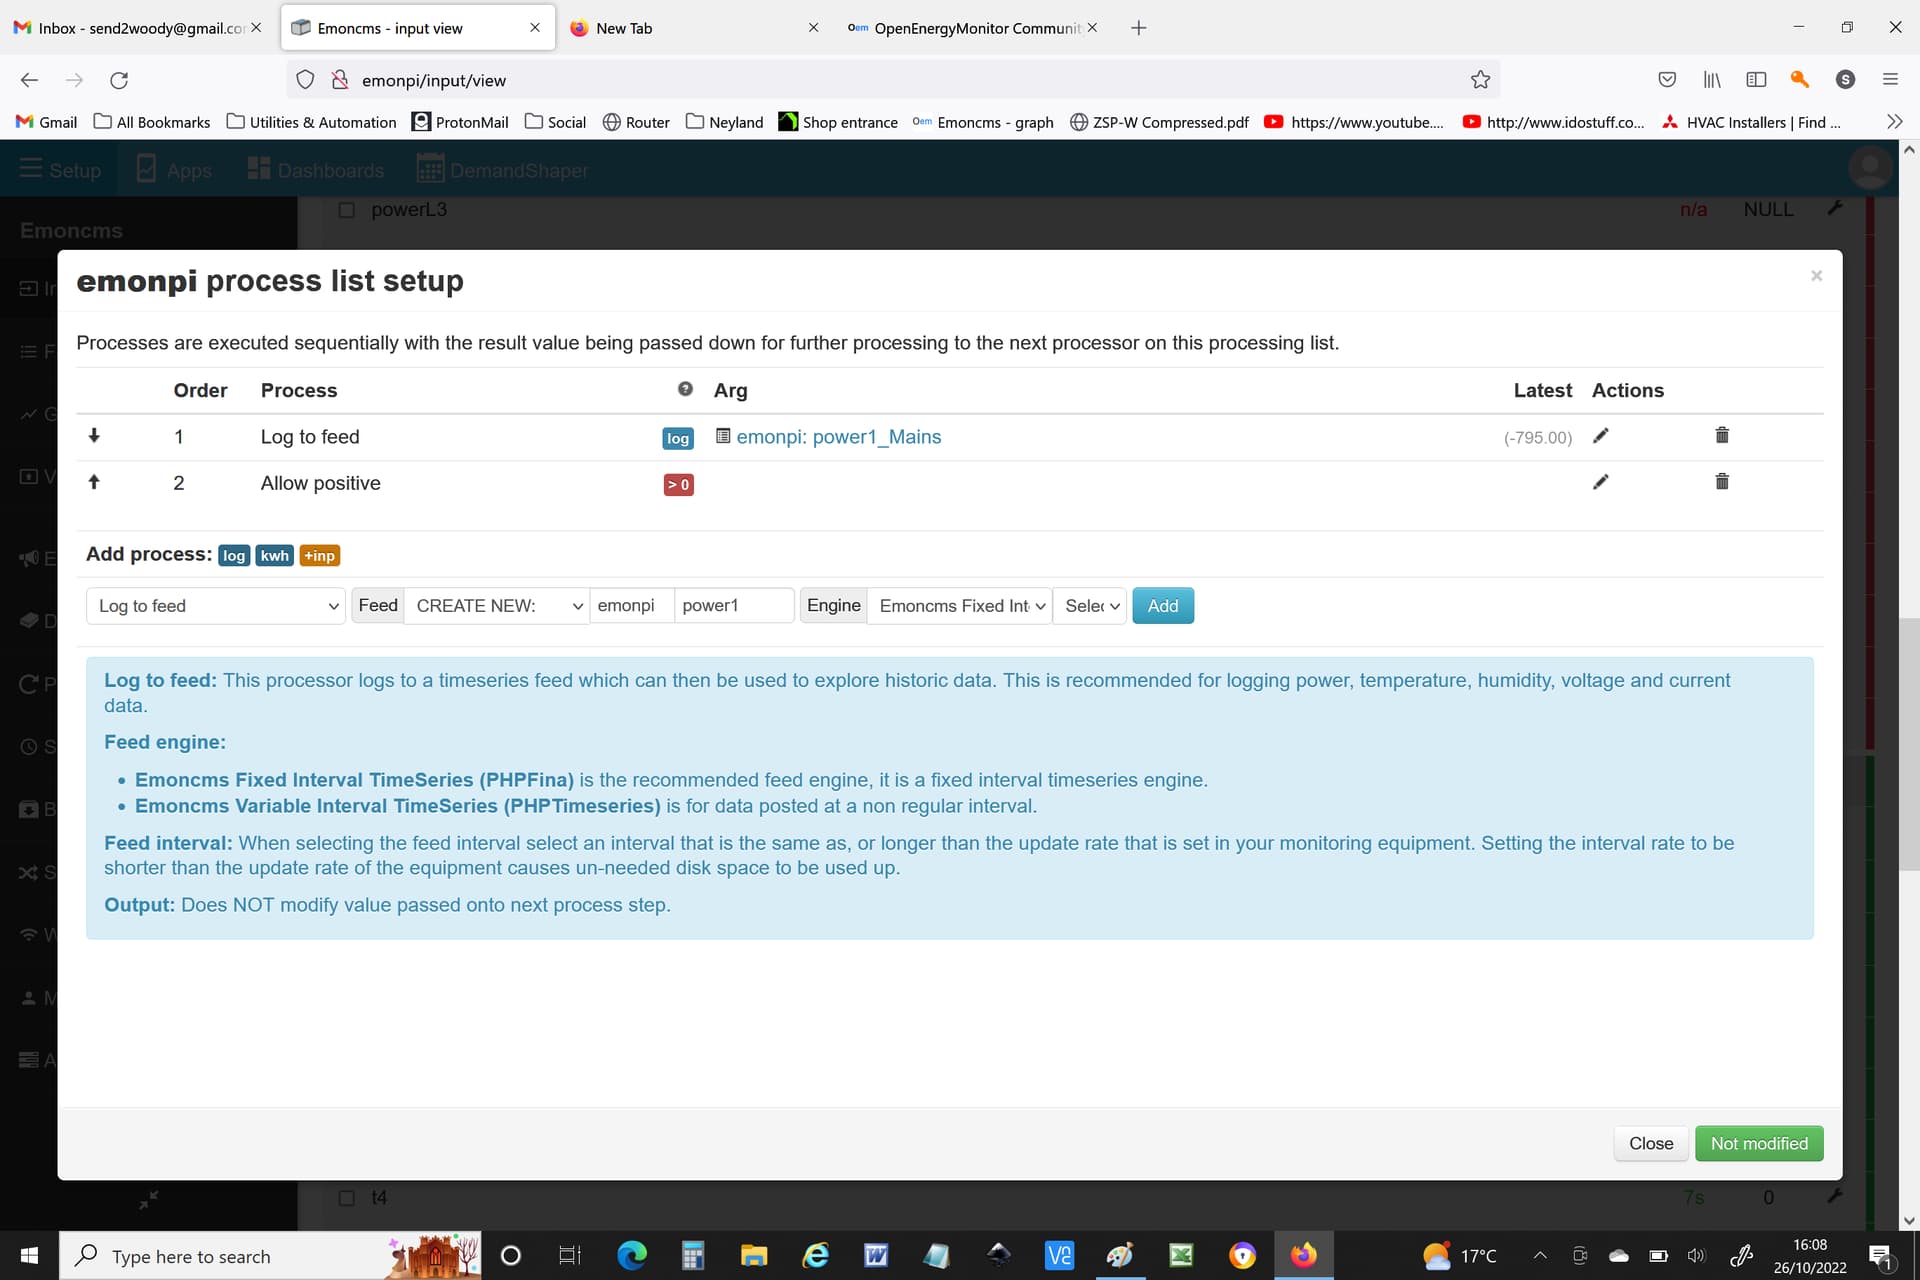
I suspect what I want to do is sumate only the positive parts of Power 1 and I can see that there is an “Allow Positive” process in the input view, but for the life of me I can use it to get the data I want.
To add what really ought to be a preface to Mick’s answer above, exactly what you add to or subtract from what depends on where you’ve put your c.t’s. Our convention is all power & energy imported into your house is positive. So when your PV is generating, that should be showing a positive value. Likewise, when you are importing from the Grid, that too should be showing a positive value. Normally, we suggest those are Power2 and Power1 respectively. Your household use is then the sum of the two – power1pluspower2. If your house is using no power whatsoever but the sun is out, then the grid should be showing an export - a negative value equal in magnitude to the PV infeed, and power1pluspower2 should be zero.
@bontwoody
What you appear not to have done in your process list in post no.1 is log to a feed. “Log to feed” is where the data is stored. If you don’t include that, it falls off the bottom of the list into the infinite bit bucket and it’s lost forever. (But note, some processes - where you specify a Feed - do save the data to a Feed.)
Morning Robert. So with the exception of my Power 1 and 2 feeds being transposed, things are as expected. I had a look at a youtube video and I cant see what I am doing wrong with logging a process to a feed.
The Input value appears automatically at the top of the process list. It is then acted on by each process in turn, the result drops down to the next process. Some processes also send a result to a Feed (but this is only when you define which Feed as part of the commands).
What are the process steps for Power1? If they are still as in your top post, it won’t. It’s only the value that (a) gets sent to a Feed by the process (e.g. “Power to kWh”) OR (b) gets sent to a Feed by “Log to feed” that appears in the Feed.
You are sending the Input value positive and negative to feed “power1_Mains”, then you do the “Allow positive”, and then the result of that falls off the bottom, because you don’t send it to a Feed. Look at the help text:
“Negative values are zeroed for further processing by the next processor in the processing list.
Output: Modified value passed onto next process step.”
There is no next process step.
Thanks Robert, I think I get it now. I couldnt find this on any instructions anywhere, did I miss it or is it just not described anywhere? Fot the benefit of any future readers my input view now looks like this and is producing a kWh output which I hope will match the smart meter readings
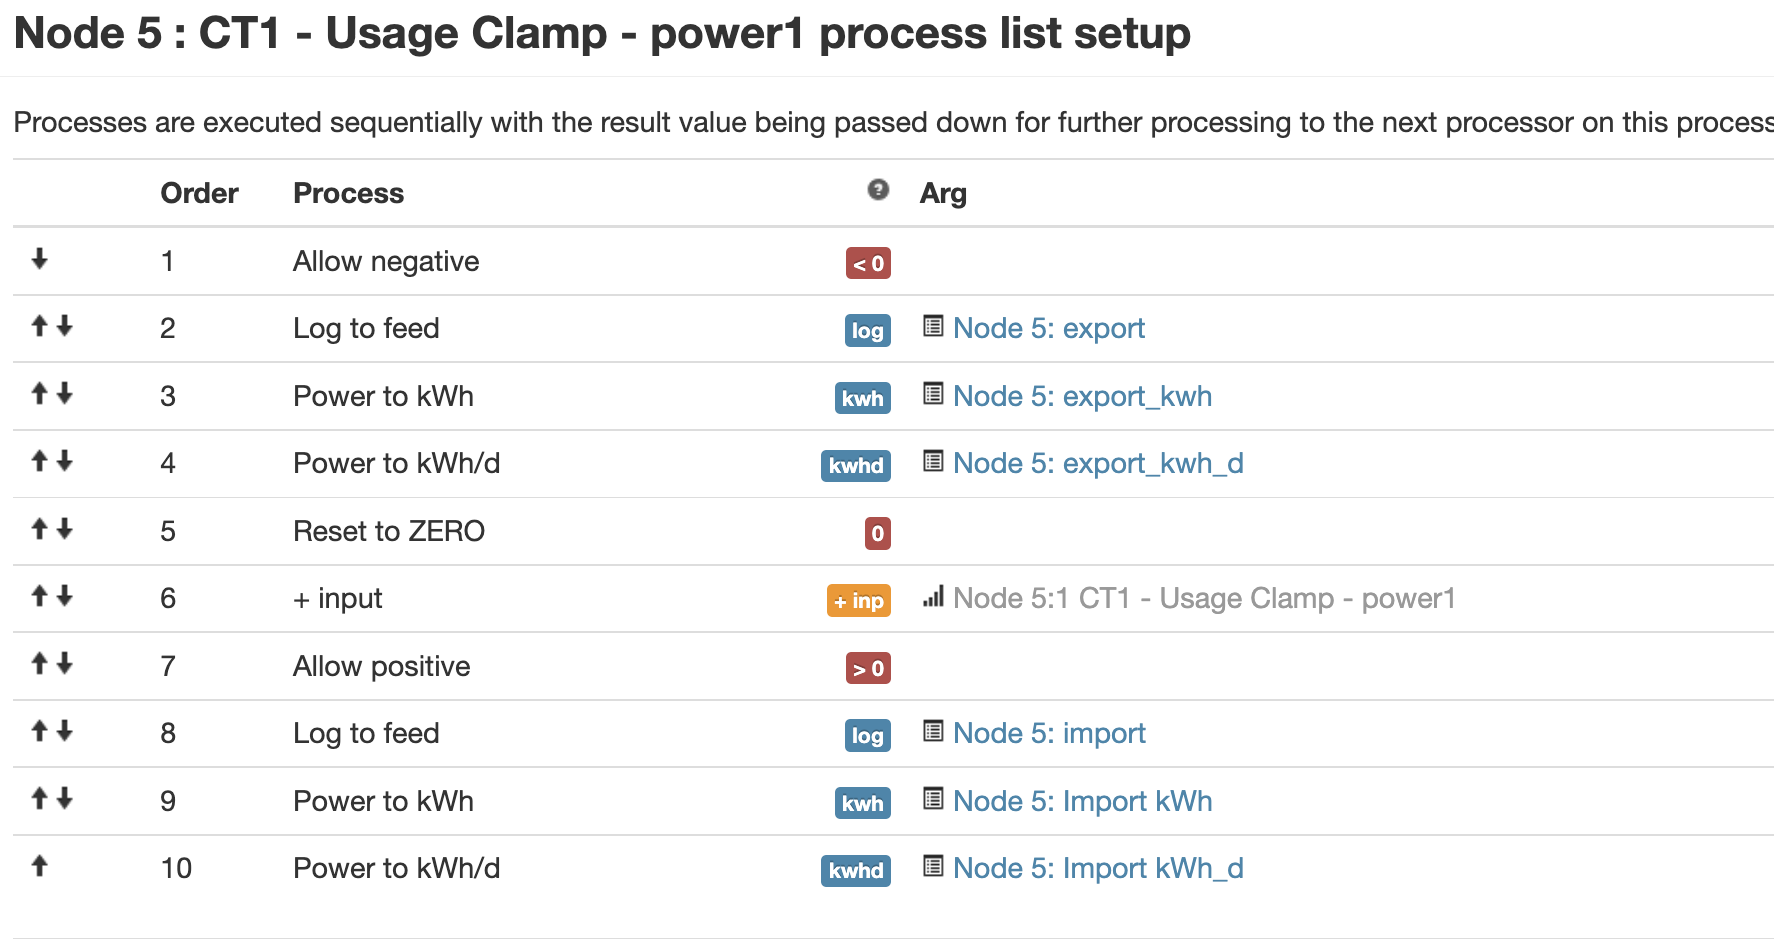
What you’re doing there with Power1 is you are logging to 3 separate Feeds (I hope):
The incoming power data to the first, the positive-only power data to the second, and the positive-only energy to the third.
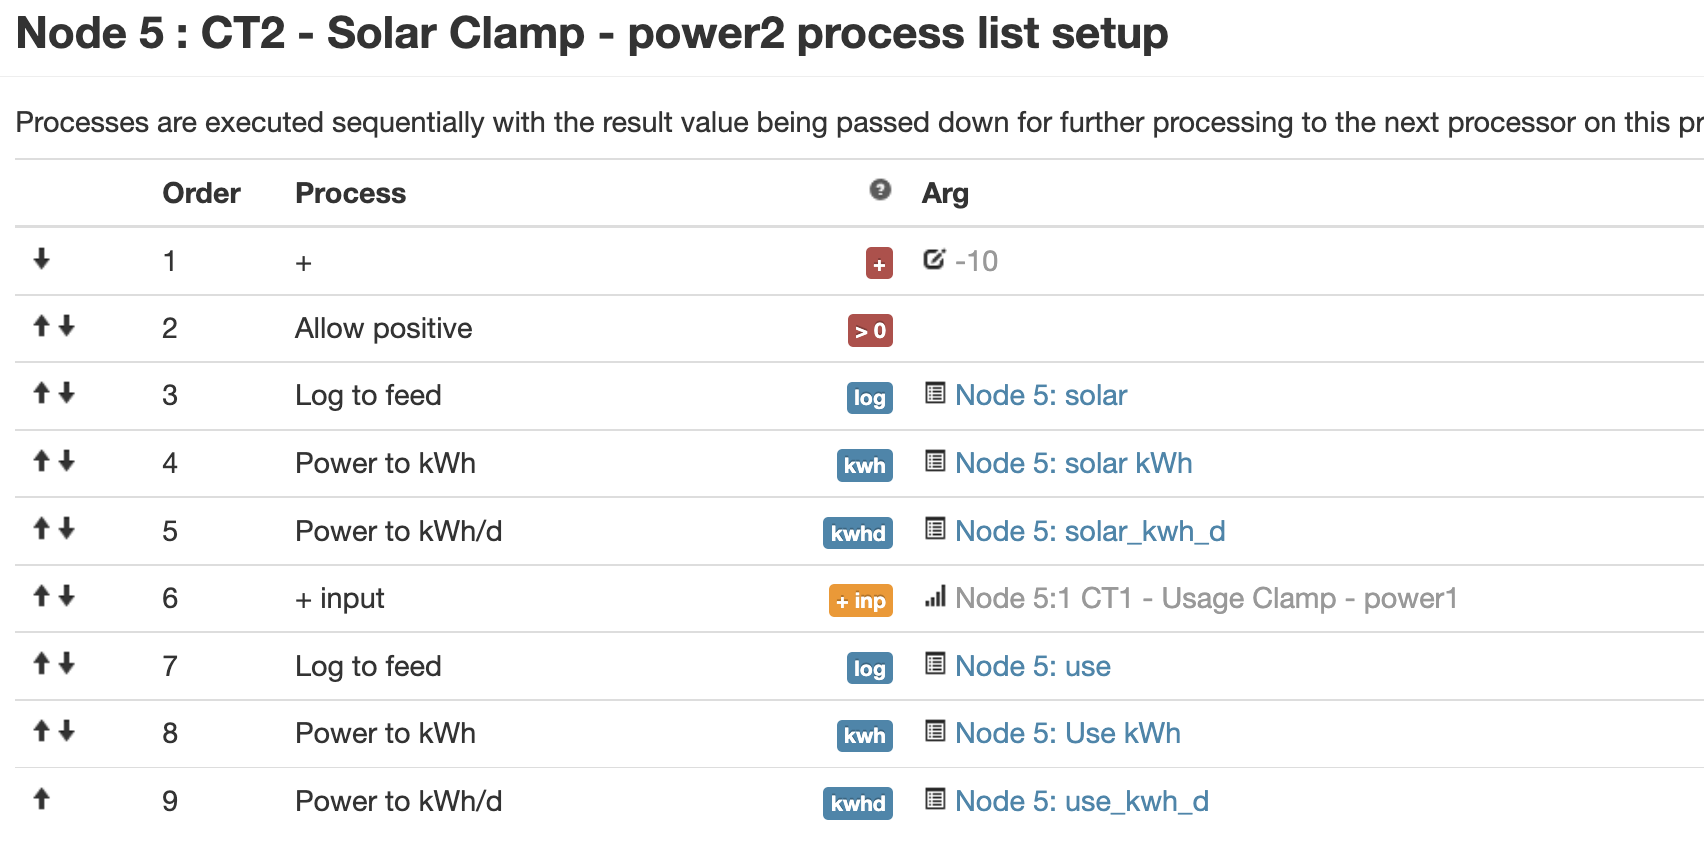
With Power2 and Power1pluspower2, you are logging to 2 separate Feeds:
The incoming power data to the first, and the energy to the second.
(If those unused temperatures etc above showing “n/a” are a nuisance, delete them. If whatever it was sends more data, they’ll reappear automatically.)
Ive just had a read of that and what I dont really get from it is the sequential and multistep nature of the task, it needs an analogy really and a couple of good examples I think to make it clear. Then idiots like me wouldnt have to bother people in this forum Thanks again for your help
Now c’mon, you chose OEM so you can’t be that much of an idiot.
Unfortunately, documentation here tends to tell you the steps you need to do, but does not tell you why those steps are desirable or necessary, what they achieve, nor explain the principles.
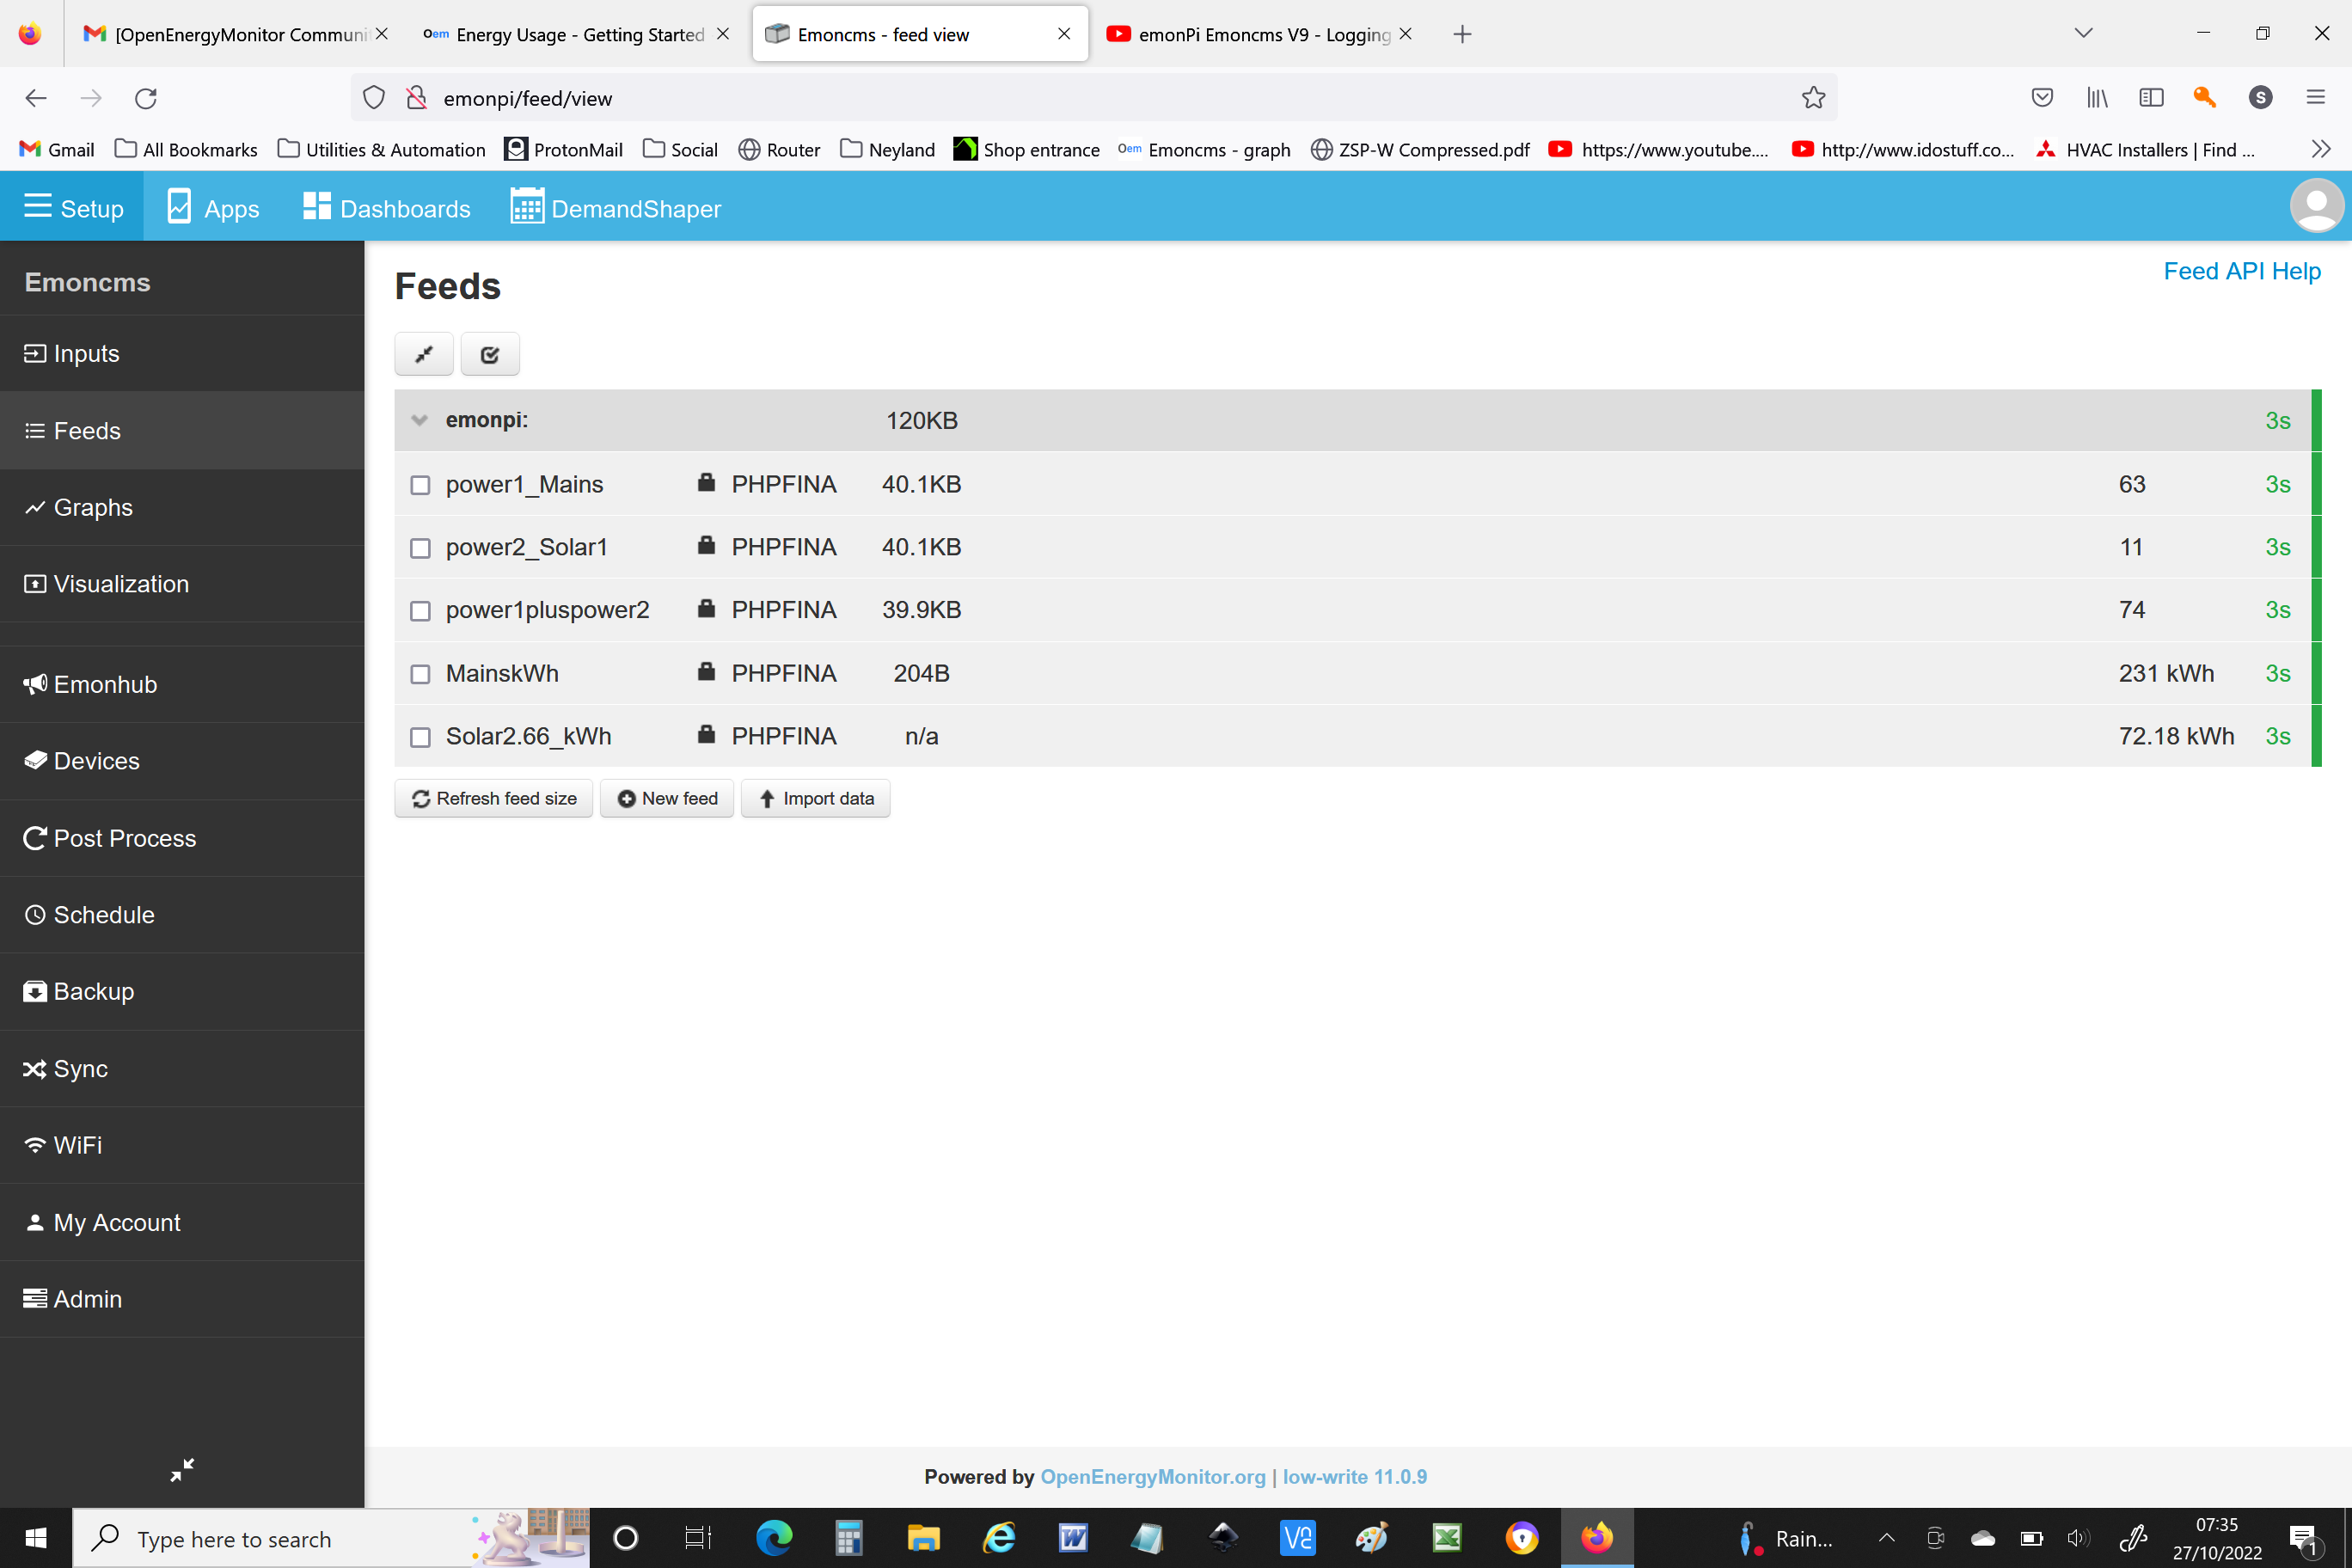
So that seems to work nicely with the smart meter saying I used 3.3 kWh yesterday and emonpi saying 3.25 kWh. However flushed with this success I thought it would now be nice to log how much export I make every day. All I should need to do is total the negative values on my mains graph, but wait didnt I just remove all of those to total the positive values . So I think you can guess my next question?
Is there a way to reninstate the values I just took out of the feed, or do I need to think laterally and try and get the value I am after by doing something clever like subtracting one feed from another?