I have just noticed a weird situation and have no idea what is happening. Would welcome any thoughts as to what is going on and/or how to investigate it.
I have a graph that summarises my electricity usage. It has behaved well for a long time but in the last two days something strange seems to be happening. I’ll show a normal page first:
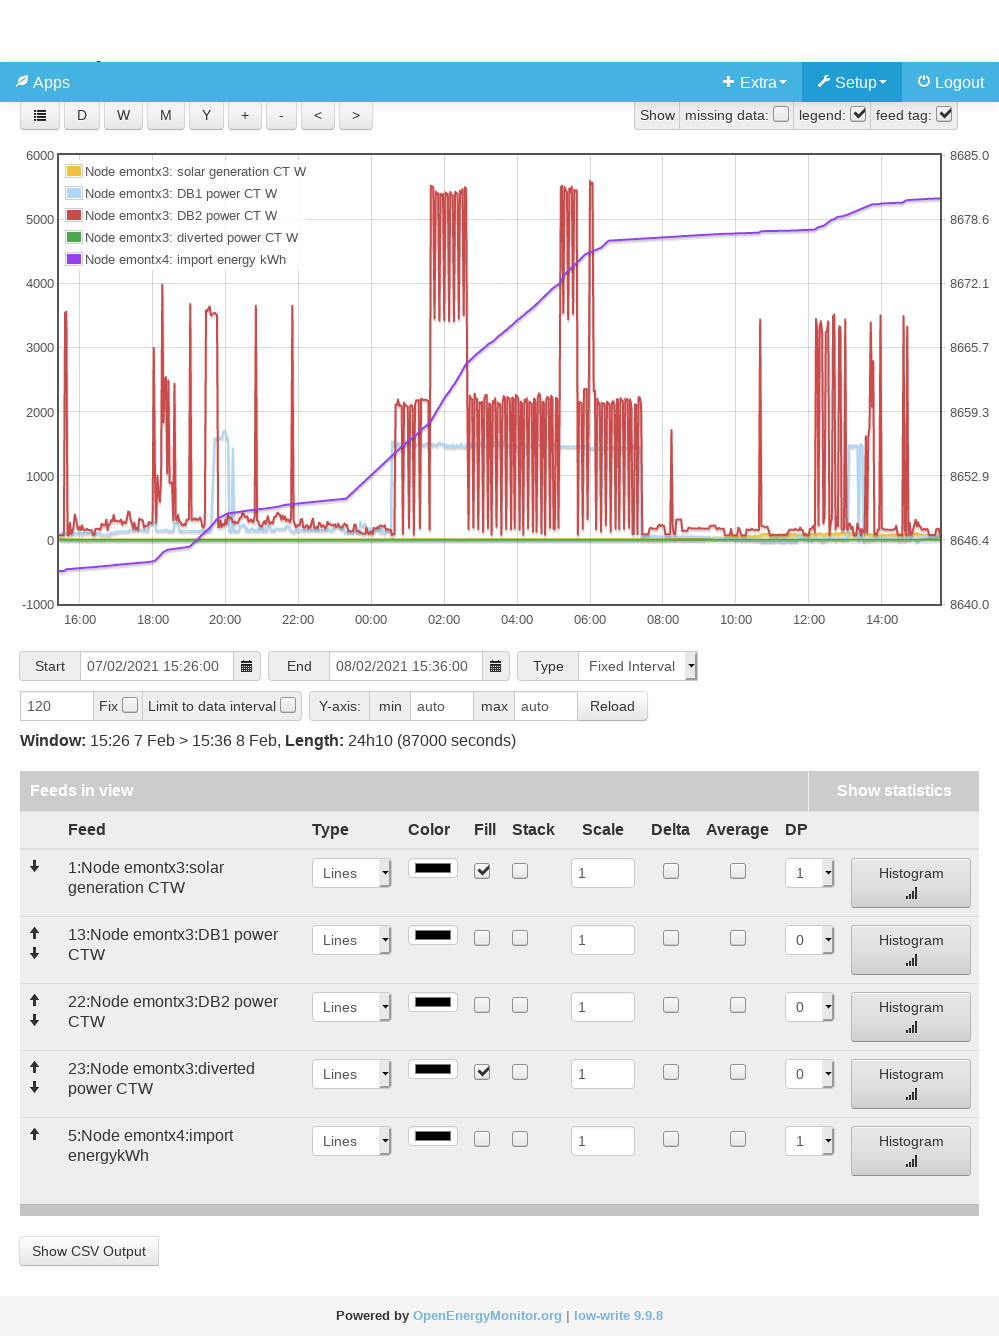
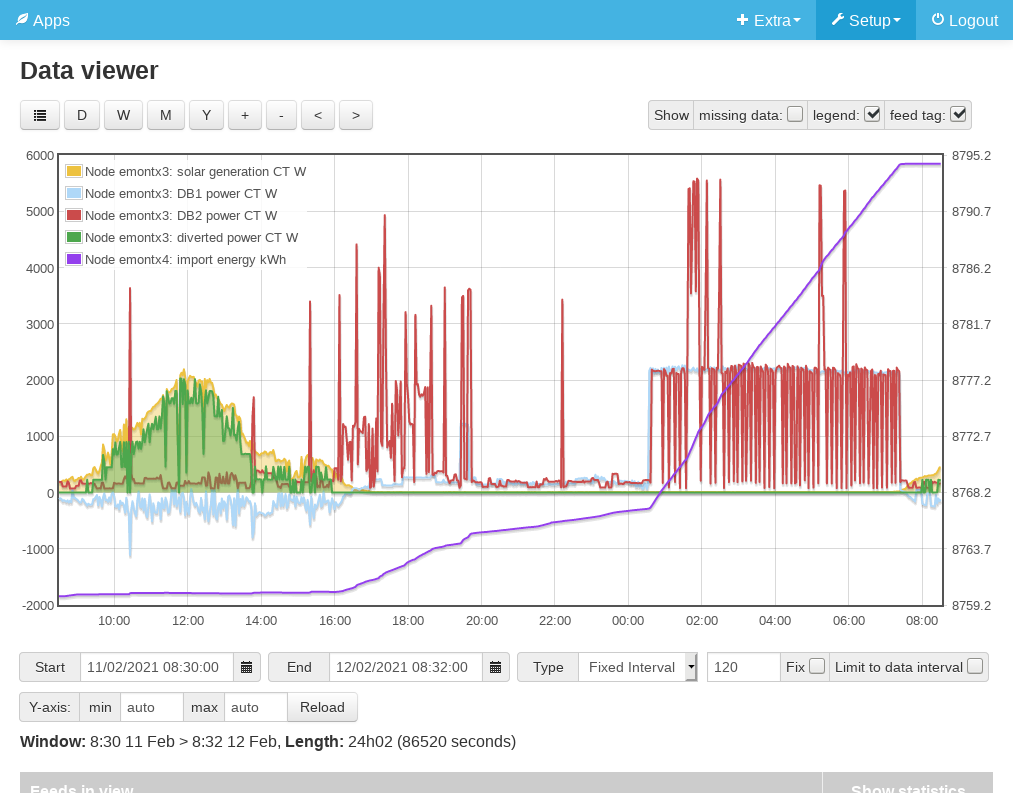
emontx3 is monitoring my CUs in the house where my emonBase is. It has four CTs fitted on my solar generation circuit (yellow), the power diverted to my immersion heater (green), and the power through the two distribution boards (blue and red). emontx4 is in the garage near the main electricity meter and the graph shows the grid import energy (purple).
So you can see various red spikes during the evening as the kettle is used and a bit between 1930-1950 where the immersion is on, plus dinnertime cooking. Then there’s a major red lump overnight as the duct heater comes on, with two extra bursts from the immersion heater. There’s more the next morning. You can also see some blue blocks where radiant heaters come on around 2000 and overnight. There’s not much solar or consequent diversion to confuse things.
The purple line of energy used roughly corresponds to the power used, although even here the timing is a little bit off, with the energy usage starting to climb about an hour before the power draw starts.
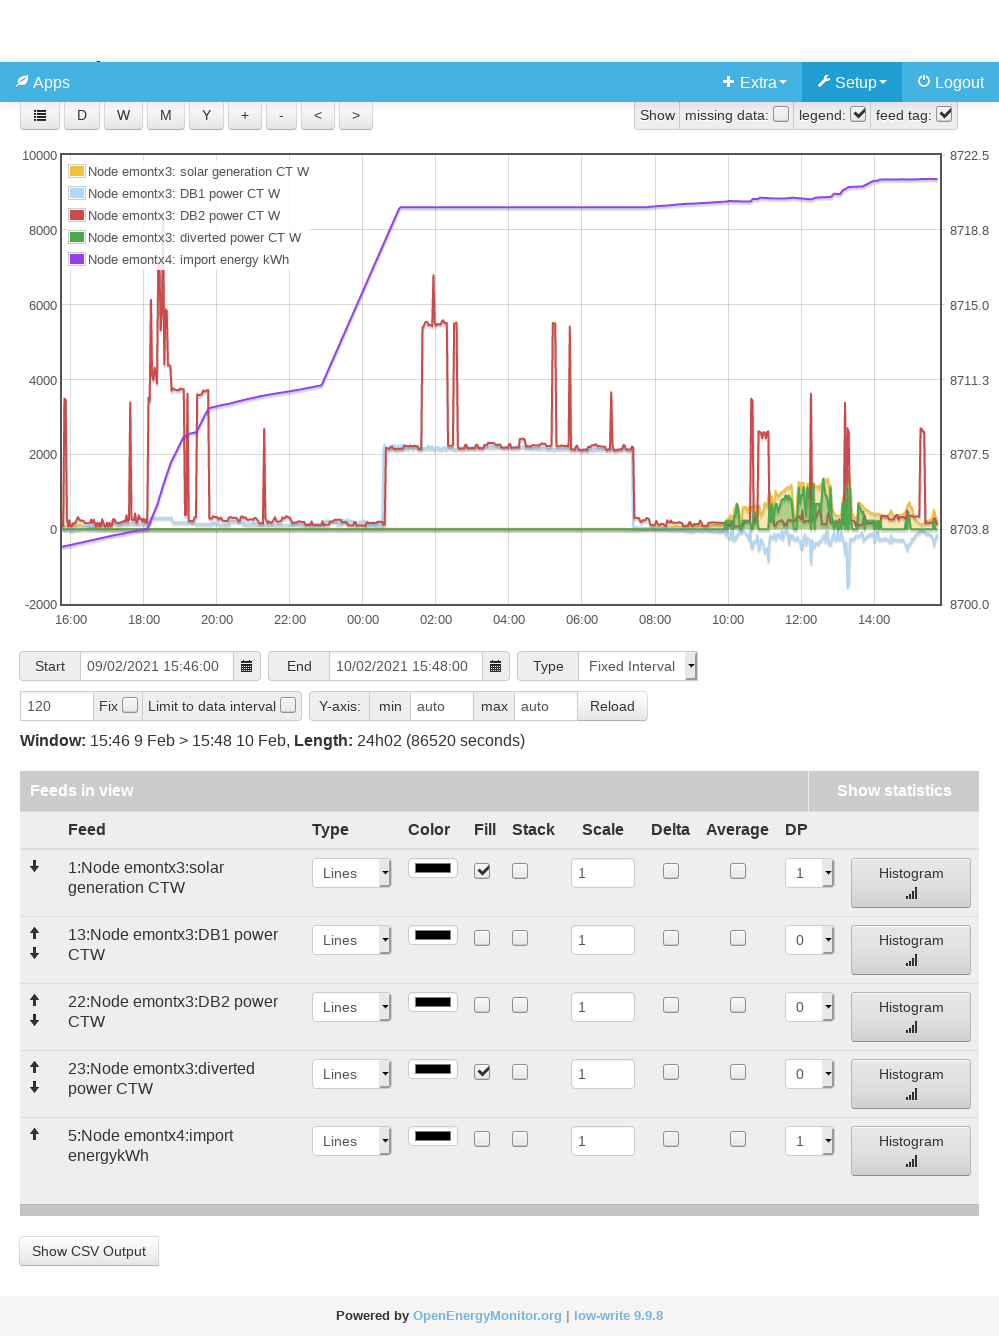
We can see that the energy graph is totally out of sync with the power usage. The energy usage is practically flat whilst the major overnight power draw is taking place!
All feeds are PHPFINA. Import energy is a Power to kWh ‘kwh’ feed.
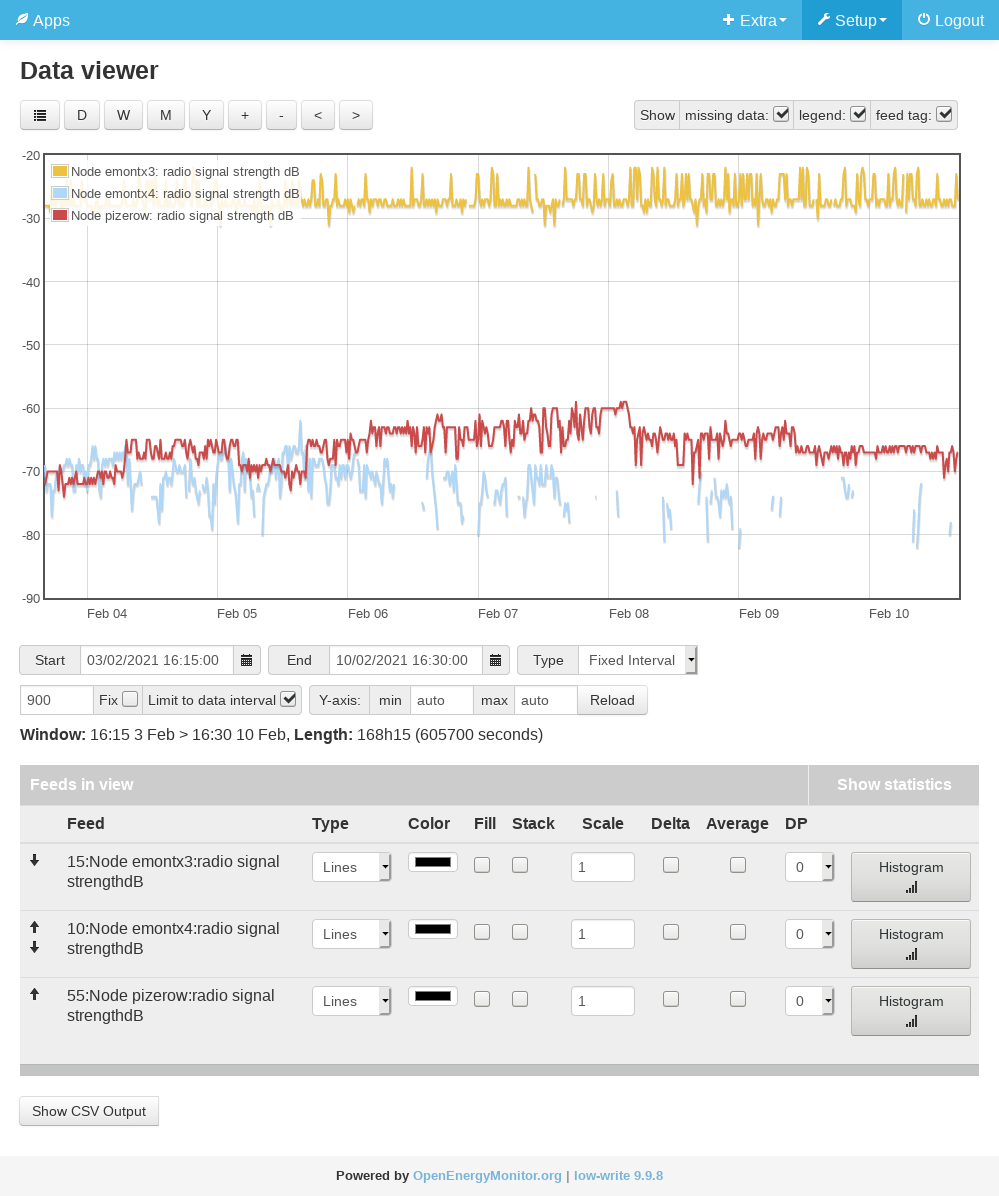
I think one factor that may be relevant is that emontx4 suffers from frequent radio transmission problems that have been especially bad in the current weather:
The interrupted blue line is emontx radio strength. Yellow is the nearby emontx3 and red is a Pi Zero W that feeds some other temperature and humidity data in. There are no interruptions shown for the purple line, which I think is a feature of the feed type. All timestamps correspond with the apparent time on the graphs when I check individual points on the graph.
Is there some problem of synchronisation with PHPFINA feeds and poor radio transmission?
I doubt that it does, though the graph might start to climb…
What’s probably happening - you can check the times and expand the graph to see where the data points are to verify or otherwise - is in the absence of a power value from the emonTx just before it hits that 2 kW step, the graph has drawn a straight line between the points it’s got, the last one being half a time division before the step and the next a little after.
It might become clearer if you draw the RSSI and some of the data from emonTx 4 all on the same graph.
Is emonTx 4 totting up the energy itself and sending the accumulated value to emonCMS? That seems as if it’s what you’ve done.
I’d look to improving the signal from the emonTx 4 - adding ground planes is a cheap and simple first step, or move either or both ends by an inch or two, just in case one is sitting in a null where a reflected wave cancels the direct path.
Sorry, you’re quite right, I should have said ‘graph’ (or ‘chart’ actually, I think) to be technically accurate
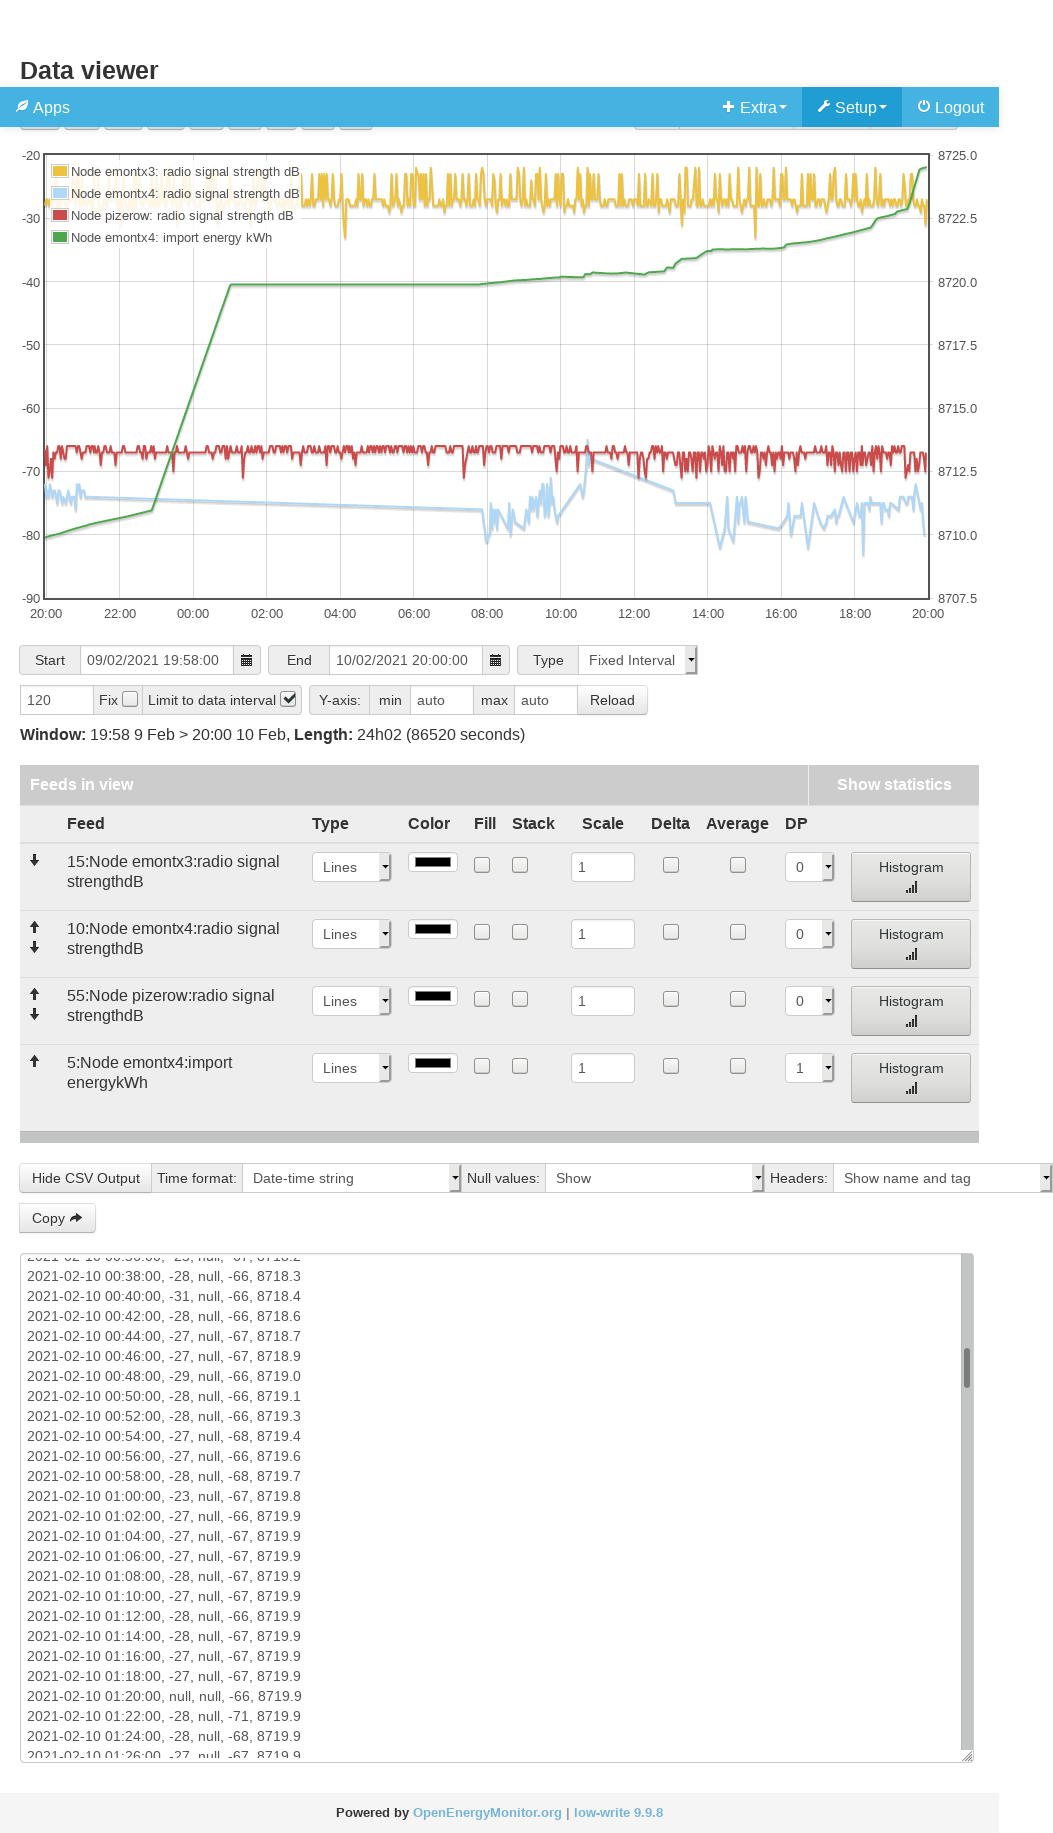
Here’s the RSSI chart with the energy added (in green instead of purple). I’ve also shown the CSV data for the period of the knuckle in the knuckle in the middle of the apparently data-free region at 01:02. (I am assuming that there is no data from emontx4 when its RSSI is missing. So I don’t understand why there would be a knuckle there.
Dunno, I don’t know how the firmware in the emonTx works - it’s the standard sketch, whatever that does. I thought feeds were derived from inputs on the emonBase box though, not on the emonTx, since it has no way to communicate instructions to the emonTx that I’m aware of? As I said it’s a ‘Power to kWh’ feed type with a PHPFINA file, all derived from the power1 input from the emonTx. Maybe @TrystanLea knows more?
Well, the emonTx has an external dipole mounted in free air, and the emonBase has its little bit of wire poking upright from the top of the case rather than coiled up inside. I’ve tried ground planes with no noticeable advantage. I will try standing it on a box to move it a little bit just in case. But the current drop outs I’m assuming are to do with the weather; lots of snow on the ground. I recently commented on my discovery that where I park my car affects the signal quite a lot on the thread where we were discussing such things.
I had just got used to the idea that my main meter data wouldn’t be continuous and started to accept it when I discovered this little wrinkle that I must try to fix. After setting up emontx3 and emontx4 I switched to PHPTimeSeries for everything and I wonder if switching to that would fix this problem. Who knows, maybe I should try it. I’d then have to try to import all the historical data into a new feed though, which would be fun.
Changing how the data is stored won’t help if the data doesn’t get there to be stored. The difference is, PHPTimeseries won’t create data points while the signal is not coming it, whereas the PHPFINA stores empty slots where the data should have been but isn’t.
That’s true - but remember, unless you fully expand the graph so that you can see every data point, you might be missing just a single message that’s skipped over when the graph is drawn. The drawing algorithm chooses every nth point, it doesn’t average a bunch of points, nor choose the nearest if the one it wanted is missing - and so if there’s no data at the point it’s chosen, that’s it, even if there is for the ones either side. So I’ll bet there’s a data point there if you expand it far enough.
If it’s a recent standard sketch, it gives you the power (P1, P2, etc) and the energy (E1, E2, etc) for each of the 4 inputs. The energy is the integral over time of the power, and it’s added up on board the emonTx and the total from day 1 as a number is transmitted each time. So even if the radio drops off for a while, it will still be correct when it comes back, although you won’t know how it changed whilst it was away.
But you can, and you are, using power to kWh, to accumulate the energy in emonCMS. But in that case, if the radio fails to get through, so does the power and the energy accumulated remains static (and what is lost while that condition prevails) is lost forever.
I presume it’s vertical - or in the same plane as the whip on the Base?
I’d guess a wall has a damp outer surface that’s being rather too effective at screening the signal.
Do you have a programmer? If so, and it’s a recent sketch, you should be able to turn the R.F. power up on the emonTx (but you must bear in mind that Dan Bates turned up the power without an Aerial and cooked his RFM69CW, so there are risks). You’d need to change one number in the sketch, compile and reload it. Max. power will give you an extra 6 dBm, but you might need a 5 V USB power supply, as the internal supply from the a.c. adapter will struggle when the mains voltage is low.
I take it a cable isn’t feasible? And what is the Wi-Fi signal like in the garage? If raising the output power doesn’t help, those are the alternatives.
I wouldn’t mind that so much. It’s the fact that the time seems to getting out of sync that bothers me.
Yes, please refer to the other thread for details of the radio installation.
The RSSI is no worse when it’s working than normal, so I doubt the dampness of the wall is too important.
No and it isn’t, I guess.
It has a separate USB supply I believe.
One of the things that attracted me to OEM in the first place was that the system didn’t rely on the wi-fi, or rather the lack of wi-fi. I can put a cable in, but that will involve major effort and disruption. I’m also considering a powerline connection.
Other than getting a programmer, downloading the Arduino IDE, the libraries and a recent sketch that’s got the energy values and the ability to adjust the radio power, then it looks as if a pair of powerline adapters might be the answer.
I don’t have any experience of those, other than to report that I had a friend who ran a farmhouse B&B in rural Scotland, and his neighbour’s milking machine blew up his Netgear Ethernet powerline adapters, and he ended up with a metre long masonry drill to get through the house wall and ran a cable instead.
The graphs seem to tally with what you say when combined with sporadic packets received from emontx4. The “timing” issues are due to lines being drawn between the irregular datapoints selected by the graphs sampling. Looking at the data packets in emoncms will have you chasing your tail because there are so many ways the data gets skewed, everything is aimed at providing a simplified general picture from a large dataset rather than every data point being absolute.
The info you need can be found in emonhub.log. I know you do not want to set loglevel to debug, but that would tell you so much about the emontx4 payloads. For starters, exactly when they are being seen and at what rssi. If you also set quiet=false then any incomplete or corrupted packets will still be seen as “discarded” packets rather than just silently slipping into the darkness.
Do you have any other spare CT’s?
The result of having just one CT on emonTx4 might be that the series of 6 zero bytes for CT’s 2,3&4 could mean the receiver is struggling to sync and the packets from emontx4 are failing CRC despite an acceptable RSSI. This issue would come and go with temperature and voltage fluctuations affecting both the tx and/or the rx ends. Plus CT1’s value will increase that string of zero values now and again too. If you have a spare CT, just plug it into “CT3” of the emonTx4 and clip it to a non-zero wire, you can ignore the reading so it really doesn’t matter what circuit as long as it’s not a “no load” circuit, although having said that even a loose CT would cause a non-zero value as it hovers around zero.
If this is what’s happening it would be very clear to see in emonhub (with the debug loglevel) but trying a spare CT (and restarting the emontx) would also do the job, just a bit more “trial and error” than the emonhub.log approach of identifying and confirming bad packets and being sure that good packets are then all passing through to emoncms faithfully.
I don’t know for sure that’s the issue you’re having but it fits the symptoms and application, the only way to know for sure is via the emonhub.logs, otherwise it’s just guesswork.
Even a spare 3.5 mm plug or two would do (even a mono one). All you need is something to remove the short to GND that the absence of a plug in the socket puts on (via the internal switch), and there’s going to be enough noise to assure a few non-zero data bits.
Even plugging in a pair of headphones would do.
If @djh wants to get a programmer and set up to use it, it’s very easy to throw together an up-to-date sketch with just one current input and a very short data packet, and if it was loss of sync as you suggest, it should go away.
Actually even just moving the one CT from CT1 to either CT2 or CT3 might split the chain of zero’s enough to allow the receiver to synchronise, I doubt I would rely on this approach to prove if that’s the issue or not, but if it is proven to be “bitslip” then it is another quick and easy option to try as a permanent fix.
I did in the end set the emonhub.log level to DEBUG I sent a patch to github to vary the number of logs it keeps but haven’t heard anything about that.
In consequence I have approx 12 hours of detailed logs. None remaining of any ‘interesting times’, sadly. Here’s a few seconds from just now to give you a flavour:
The RSSI values I see always seem to correspond with what emoncms shows me. I’m not sure what else I should be looking for?
Afraid not, just what’s in the production system. I might be able to dig out a 3.5 mm jack if that’s useful though.
I stood the emonBase on a box last night. It seems to have increased signal level by up to 10 dB so maybe the problem is ‘fixed’ for now. i.e symptoms gone. Time will tell.
Especially if the values shown two posts above this one were what you were getting after you
put your emonBase on the box. If they were, the RSSIs in the -80s would be very close to the edge, if not a bit beyond, reliable operation. (the RSSIs of -28 and -65 are OK)
If the post shows the RSSIs before you put it on the box, then you should be OK. But if that’s all it
took to make that much difference in received signal strength, there are other factors at play.
e.g. multipath, a detuned antenna, moisture in a feedline, to name a few.
Hmm, I must have been more tired than I thought last night / this morning. What I actually did was get a box (about 100 mm high), go downstairs to the emonBase, discover that it was already sitting on a small box (about the height of the pi case), so I removed the little box and didn’t use the bigger box. There are only a few small dropouts now and the symptoms have gone. So the emonBase is now sitting on a laminate worktop; I’ve no idea whether that looks like a ground plane at the RF frequency.
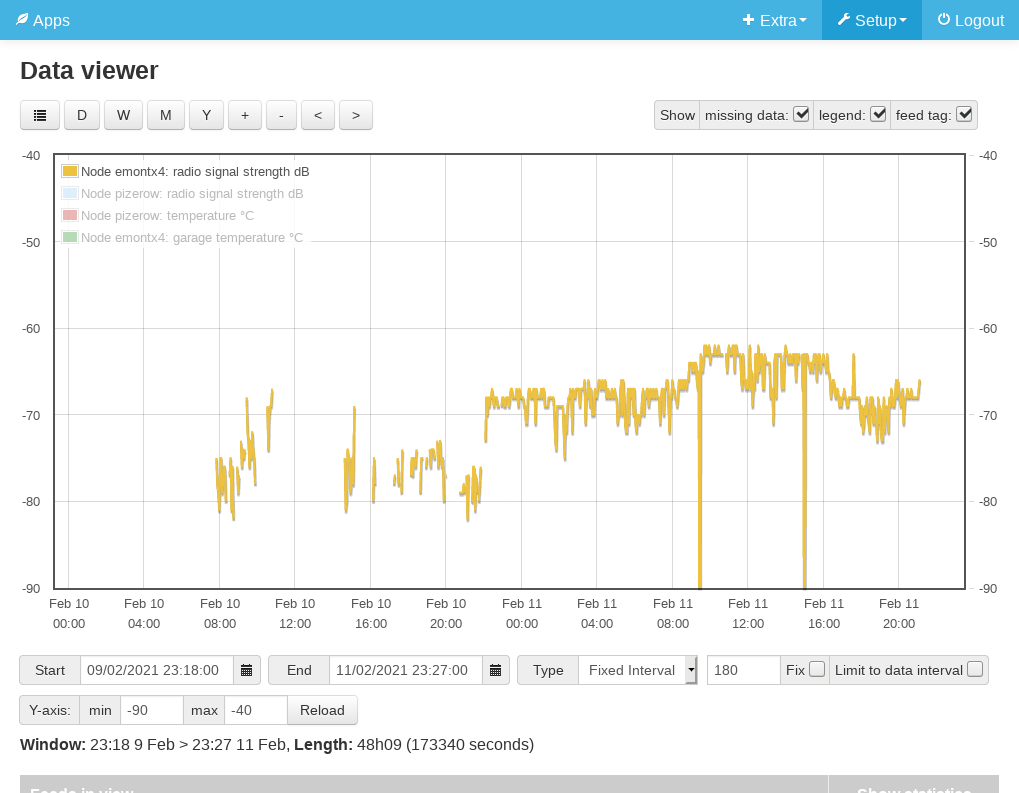
All the previous charts showed data from before the move. The environment the emonBase is sat in is quite complex. It’s just underneath the CUs and associated emontx3 and alongside cable runs down from the CUs and other gubbins; it’s right next to my Internet router, which is right next to my Dect base station and the phone master socket. Here’s a couple more charts to show the current situation and how it compares:
Above is just the RSSI of the problematic emontx for the past two days.You can see the jump in signal level about 22:00 yesterday when I moved the emonBase and the much more reliable signal afterwards.
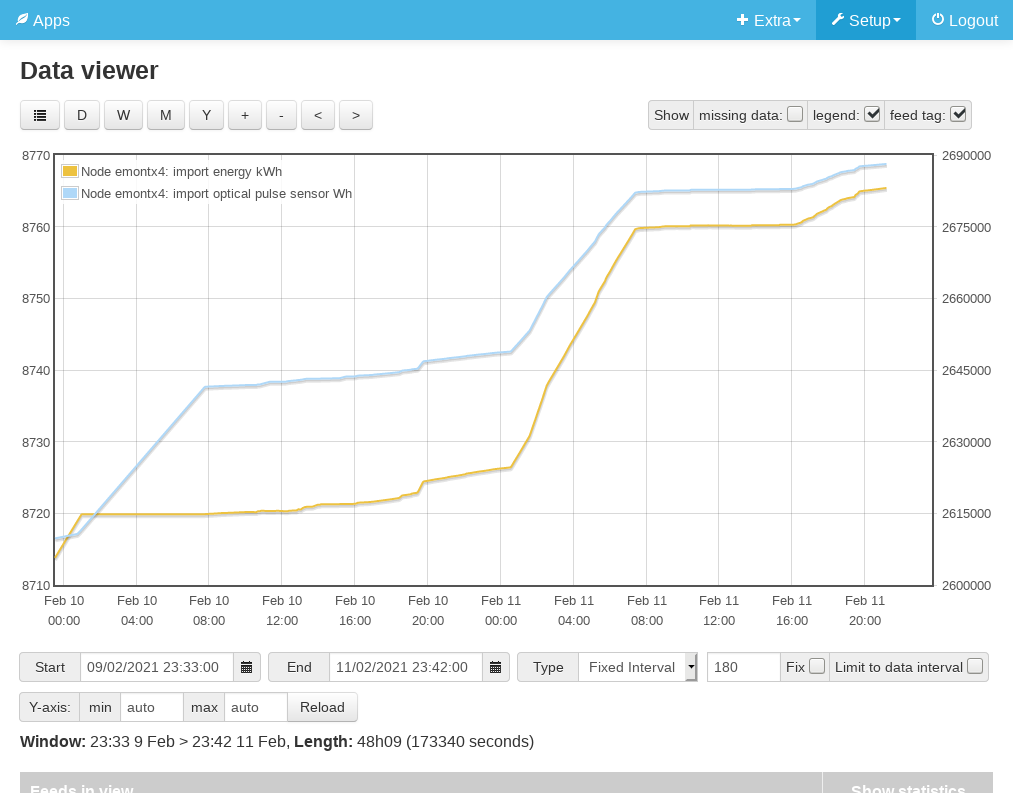
Below is a comparison of two measurements of the same thing: the net energy imported from the grid into my house over the past two days. Yellow is the problematic value derived from the CT’s power reading. Blue is the value from the optical sensor on the meter. Fairly similar in shape today but very different yesterday. Both differ from the actual meter reading of course, which was 31596 kWh at the beginning of this month.
The blue value counts both imports and exports as positive; it also got reset by one of the power cuts last year - it’s true value is about 13520993 Wh. The yellow value offsets exports against imports and also gets reset every time there is a power cut, so is much lower.
I’ve had a request to look into saving the present values when there’s a power cut, to restore them on restarting. I don’t yet know whether it is feasible, but if it turns out to be, then that problem would go away.
I’m not sure it would be worthwhile to be honest. The emoncms system has the same data and could afford to spend some compute time recalculating things afterwards. I’d think it was better to put the intelligence in the central system where it’s easier to reconfigure etc. At some point I may reprocess my optical readings to separate out the import readings and the export readings for example. It’s easy to add extra processing to do that in the pi.
The thinking was, it would make it behave more like the supplier’s electricity meter.
In your (past) situation, there the power readings were never received. Had you been using the accumulated-at-source energy values, those would have been correct until a power cut. If that last value can be stored in the emonTx’s dying gasp, then the energy count can carry where it left off when power is restored.
Yes, my point is that the emoncms system can carry out that calculation just as well, with more possibility for easy customisation and configuration.
For example, if you want to emulate the physical meter then when is it going to wrap around? How many digits, Wh kWh or something in between (two decimal places?)
How are you going to initialise the reading to match whatever’s on the meter when the emontx is first connected? And if you aren’t, why bother?