EmonTx v4 for Homelab Monitoring? (Low Wattage)

Here a go at a stripboard-based solution:

I chose a 50mA fuse as a midpoint between the maximum expected current of 20mA and the inferred maximum 105mA current of the 18Ω resistor (which seems like the most likely component to get too hot)

The maximum resistor current was calculated as follows:

I = sqrt( P / R )
I = sqrt( 0.2W / 18Ω)
I = sqrt(0.01111)
I = .1054A

Does that all look OK?

Thanks again! :pray:

I would not trust removing circles of each track as shown. Use a 3 mm wood chisel and remove ALL the copper (6 tracks) between the mains side and the low voltage side. It is equally important to remove all the copper underneath and around the fuse, because you will have the full mains voltage appear between the ends of the fuse after it has ruptured. Removing the copper between the ends of the 18 Ω resistor isn’t important (there’s only a very low voltage between the tracks), likewise on the low voltage side.

A 50 mA fuse will probably be OK, unless there is significant inrush on your load. Theoretically, a 100 mA fuse should protect the resistor - but if the resistor becomes open-circuit, nothing will protect the ZMPT101B.

1 Like

Done! (Virtually :grin:)

Noted.

My main concern was protecting against accidental connection of a large load. For example, the computer at 400W.

However, if it is possible make the fuse more effective by modifying the circuit, I am all ears!

The best protection is to be very careful.

The winding resistance of the ZMPT is 110 Ω, and the data sheet shows currents up to 8 mA (rms), implying a peak voltage across the winding of not less than 1.24 V. At 2 mA, the number is ¼ this, so a pair of silicon diodes in inverse parallel across the transformer primary should protect the ZMPT (and blow the fuse) in the event the 18 Ω shunt resistor goes open-circuit. Obviously, the diodes must be rated to ensure the fuse blows first, before the diodes!

1 Like

You don’t have to make your own ZMPT board if you can live with manually reading an LCD display and writing down the Watts or kWh in a note book. A “Plug In Energy Monitor” can save you the bother and keep it safe. For a low power group such as modem+TV+raspberry pi, those are about right to the nearest integer Watt (! no good for less than 2 Watts because of rounding error!) (up to 3.2kW max rated from a 13 Amp UK socket) and might show that the 3 Watts or so drawn by the raspberry pi is not perfectly additive with the 20 or more Watts drawn by the TV. Household electronics loads such as modems don’t always draw a perfect sinewave as would an ordinary resistive load such as a toaster. LED saver bulbs and 1980’s VCR boxes are the worst which I’ve seen for not plain resistive and liable to confuse the sampling of emon. Adding a <50 Watt funnywave group such as the raspberry pi and stuff to an ordinary household net load won’t get consistent results, no matter how good is your CT probe, so I say that it is best to get (unless you can make) a seperate monitor.

Are you suggesting the emonTx4 does not calculate the true average power? Can we see your evidence?

In theory, I expect that emon averages some number of (I.V) power samples per 20ms mains cycle. I have not looked at how the low pass filter before sampling in a emon is set up, so I only presume that it might cope with 1ms upspike 1ms downspike from a saver LED bulb on its own. I’d like to see how switching one on looks in a typical household mains net power record, amongst all the usual variations. In my homebuilt setup, I am confident to spot a 50 Watt event such as the fridge going on, but a 3 Watt raspberry pi would be lost amongst usual variations in household net power.

An old 1980’s electronics box such as a VCR drawing 3ms upspike 3ms downspike might also work fine on its own with an emon, but I’d rather not try to look for 3 Watts to a raspberry pi amongst the household net power record. I prefer to use a seperate plug in power monitor to look at the kWh through only a single 3-pin socket as a way to find out the relative importance, defined as kWh per week, of single appliances or small groups of appliances. I get no charts, but it tells me enough of what I need to know for bill reduction decisions.

I think there’s a lot of guesswork there. All the code is readily available – why not get the facts first before you offer opinions based on presumptions?

1 Like

I do not intend to become expert in emon before presenting an opinion, which was intended to be helpful to people who have decided to look at their small electricals group such as raspberry pi plus modem plus telly, and might find it helpful to see it mentioned that they can get the end-of-the-week total kWh number without necessarily building something which looks tricky.

Thank you for raising the possibility of an easier solution!

However, the main goal of my project is getting granular and consistent data logging over time every hour, minute, etc.

How did you verify that accuracy? I have a picture somewhere of two different models measuring the same low load - one claiming about 70W and the other about 2W. Clearly at least one of them wasn’t anywhere near the nearest watt. A common shortcut in some of those is to just measure apparent power but report it as real power.

That comment makes me think yours is one of those meters that takes said shortcut, in which case it’s likely the reading is way out for the type of loads being discussed here. If it were rmeasuring correctly they should indeed add up consistently (rounding errors aside).

Your revenue meter can measure it accurately. If you design a meter that uses similar techniques it should too.

Therein lies the problem.

2 Likes

@Robert.Wall Does it seem possible that a circuit without the ZMPT connected would draw more current than a circuit with the ZMPT connected?!

As a starting point, I measured current used by the pi picos without the complication of the ZMPT. Everything in tests # 1-6 was making sense.

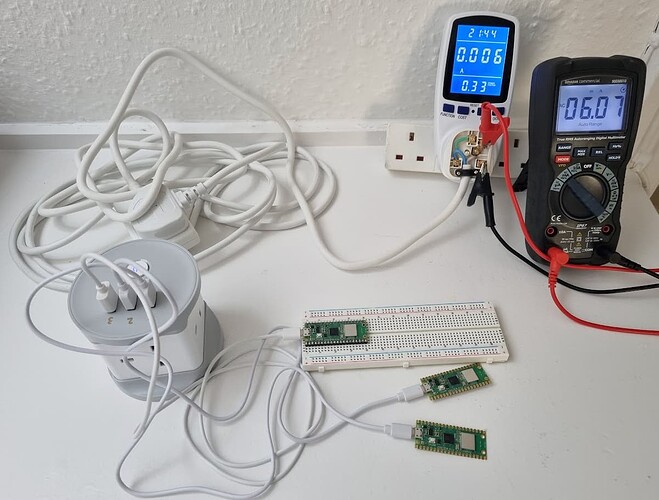
  • The wall monitor agreed with the multimeter exactly, down to the measurement floor of the wall monitor.
  • The current decreased as the number of pi picos decreased.
Id Wall Meter Multimeter ZMPT Connected? # Picos Note
1 6.0 mA No 3 Meters connected one at a time.
2 6.0 mA No 3 Meters connected one at a time.
3 6.0 mA 6.0 mA No 3 Both meters connected at same time
4 0 mA 4.6 mA No 2 Floor of wall meter range
5 4.6 mA No 2
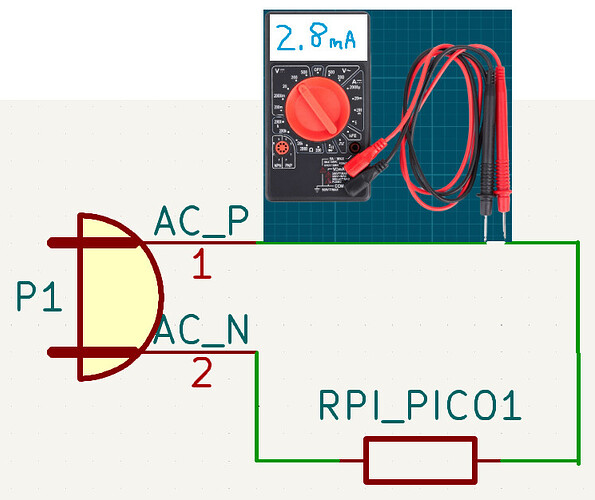
6 2.8 mA No 1

After test #6, I was relatively confident that an individual pi pico draws 2.8 mA of current.

I felt comfortable wiring the ZMPT without any additional resistors because current was less than 3 mA.

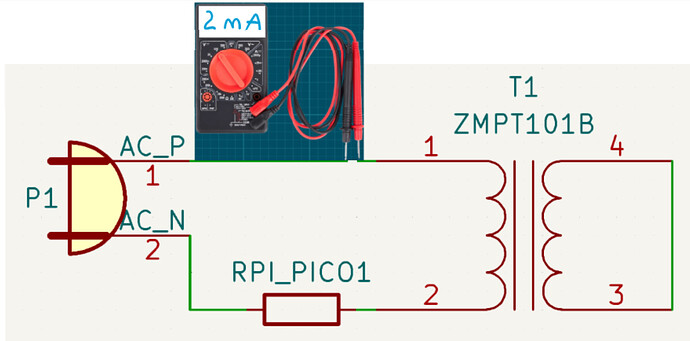
  • The idea was to isolate the resistance of just the ZMPT.
  • Current was measured between P1.1 and T1.1
  • Voltage was measured between P1.1 and T1.2
Id Voltage Current Calculated Resistance ZMPT Connected? # Picos Note
7 2.0 mA Yes 1 Why is current less than Test #6?!
8 308 mV From Test #7 308 / 2.0 = 154 Yes 1 Is 154 Ω Correct?
9 308 mV From Test #6 308 / 2.8 = 110 Yes 1 Is 110 Ω Correct?

Schematic of Test #7:

The only reason I can think of to explain these results is that the ZMPT causes the AC to 5V DC power supply to become dramatically more efficient. Is that possible?

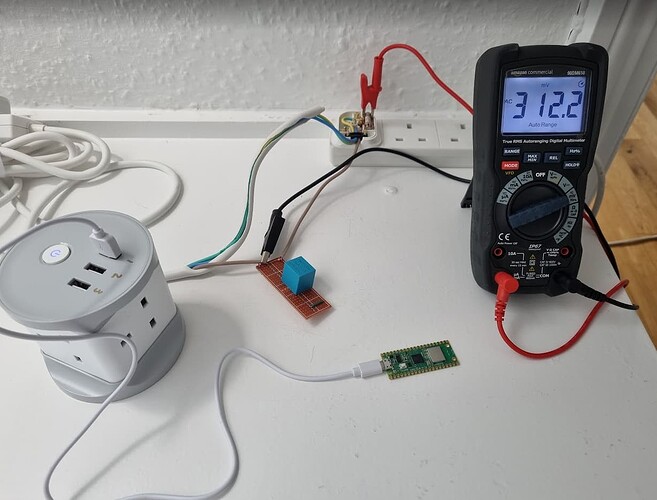
Additional Info: Some photos of the physical setup.

Test #3

Test #6

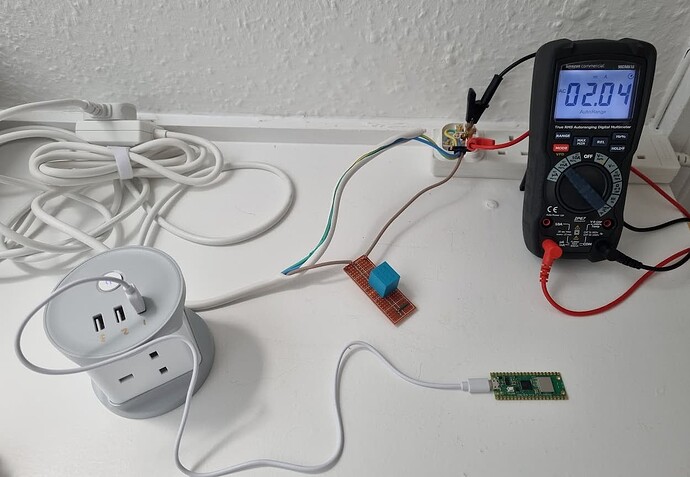
Test #7

Test #8/9

FOR ANYONE LOOKING AT THOSE PICTURES, PLEASE DO NOT WORK WITH AN OPEN PLUG. IT IS HIGHLY DANGEROUS.

Get one of these. When the lid is open, both line and neutral are isolated:
image

https://cpc.farnell.com/cliff-electronic-components/cl-1850/quick-test-block-no-lead/dp/PL16023?st=test%20block
I know it’s expensive, but is someone’s (your?) life worth £44.72?
(Also available from various other suppliers.)


This is definitely possible. But have you overlooked the fact that the Pico is running at a lower voltage because the ZMPT is in circuit instead of your meter, and do you know what the voltage drops of each are? It might be running at a lower voltage and drawing less power and hence less current - or it might not. The converse could also be true - if it has an internal regulator and it’s running at constant power, the current would be higher at a lower voltage and lower at a higher voltage. You’ve got too many variables and you need to isolate them.

It’s moderately well known that a SMPS is designed for best efficiency over a range of output currents (assuming a fixed voltage), but you’ve got its own operating power as a fixed overhead, and losses that are variable over the operating range. All of those impact the efficiency, but only the designer is likely to know how in detail.

It might be more instructive to first, measure the current & power consumption of your Pico on the d.c. side, over a limited range of voltages - this will give you a base line to work from. Any power above this on the a.c. side is losses in the conversion from a.c. to d.c. Then, use a rheostat (as distinct from a potentiometer - a rheostat is designed to have current drawn from the wiper) to vary the load on the converter. You’ll get many more points on the curve of power in vs power out and it should be a lot easier to interpret the result. You can try the effect of some smoothing on the d.c. side, but I’d hope not to see much if any difference.

Thanks for letting me know about the quick test block. I’ll refrain from posting any additional photos of ill-advised test setups. :slight_smile:

Further updates to come, once I take some DC measurements.

Even better if you refrain from using an open plug. I’ve heard the Safe Block called a “Death Block”, but it does offer several features to make testing more convenient and with a lot less risk attached.

Yet another solution…

This device can measure current down to 1 mA:

From the webpage at the link shown above:

Dr. Wattson is an Energy Monitoring Module from Upbeat Labs that allows you to easily incorporate high quality AC energy monitoring and measurements in your next project! It is coupled with easy to use Arduino and Python libraries that together with the Dr. Wattson Module make getting quality AC energy data like RMS Current, RMS Voltage, Power Factor, Line Frequency, Active/Reactive/Apparent Power a breeze.

The unit comes pre-calibrated, enabling you to start taking quality measurements from 90-240v, at either 50 or 60 Hz, and for currents up to 15A. You don’t need any additional CT/VT or other components.

Dr. Wattson is based on the MCP39F521, a single-phase power monitoring chip from Microchip.

The board is designed to be tolerant of different logic levels using bi-directional level shifting, so it can be used with both 5v and 3.3v systems.

Dr. Wattson caters to both the novice and advanced user! The libraries are very comprehensive and allow for advanced usage, while still making it intuitive and easy to use for the common use-case.

If you’re familiar with the MCP39F521 and its calibration and other commands it supports, you can also change the measurement range by changing the burden resistors on the board and recalibrating the board (essentially treating the Dr. Wattson board as a breakout board for the MCP39F521).

Whether you want to measure small standby power consumption or larger loads, Dr. Wattson has you covered. Boasting a 4000:1 Dynamic Range, and capable of 0.1% accuracy, the MCP39F521 is a versatile chip, allowing you great flexibility with measurements. Dr. Wattson takes that flexibility and makes it easy to use! Dr. Wattson comes calibrated to measure currents from 5mA up to 15A.

[Version 1 of the Dr. Wattson board came calibrated for measurements between 1mA and 4A (with a 15A conversion option you could do yourself or we did it for you for a small fee).We have made measurements up to 15A the default in the V2 unit. If you want to measure down to lower currents (like measuring standby current usage), you can change the burden resistors and apply the calibration settings we provide for that lower range. Instructions will be provided!]