emonTx V3 not updating to emonBase

I’ve a system which was working fine and suddenly the emonTx V3 is not updating to emonBase. I know the emonBase is working fine as my emonTH is logging just fine. If I reboot or unplug and re-power the emonTX it then logs a single data point and then stops updating again.

I purchased and setup all of this kit from OEM recently so it should all have the latest images etc.

Any idea of what I should check/try to start troubleshooting this issue?


EDITED - Removed links to live data as they exposed an apikey and once fixed. the described symptoms would no longer be displayed and possibly cause some confusion, A screen grab of a clear occurrence is usually better. (pb66)

Does the LED on the emonTx continue to flash every ~10s after the initial setup?

Does the LED on the RFM2Pi flash to confirm receipt of the packets sent by the emonTx? (does the led flash at almost exactly the same time as the emonTx’s?) The LED is qute small but if the emonTH is working you should be able to see those confirmation flashes as well.

Can you check emonhub.log on either the emoncms’s emonhub page or directly on the command line via SSH by using tail -f /var/log/emonhub/emonhub.log. You may need to set loglevel = DEBUG in emonhub.conf too. Is there any sign of activity from the emonTx there?

Can you try setting “quietmode = false” in the [[RFM2Pi]][[[runtimesettings]]] to see if the packets are being received but failing the RFM2Pi’s crc checks too?

Do you have a USB programmer? If so you could also hook that up to debug the emonTX directly by confirming the seial output.

1 Like

I also have this, or a very similar, problem. My emonTx v3 is recognised by emonPi, but reported as inactive after the initial report when the emonTx is turned on. I have output from the emonTx serial port that is what I would expect. Any ideas?

Unfortunately the emonPi’s LED is located next to the mini USB socket so it’s not visible when in the case and you cannot switch off the “quietmode” for debugging, but there may still be some clues in emonhub.log

Can you post some emonhub.log if there is any activity for that node or if there isn’t can you restart the emonTx and post the log showing that first packet and the following 20 to 30secs?

What do you see in the serial output? does it appear correct? can you post an excerpt?

It will return it’s firmware version number at startup then post power values every 10s. Please post output here

This might have been seen before: emonTx locks up after a week or two, needs to be repowered | Archived Forum

Well, now I don’t get anything from the emonTx serial port. The emonhub.log (either via local emoncms, or putty (tail …) is:

“2016-05-07 02:19:07,691 DEBUG RFM2Pi 4969 Timestamp : 1462587547.69
2016-05-07 02:19:07,692 DEBUG RFM2Pi 4969 From Node : 5
2016-05-07 02:19:07,693 DEBUG RFM2Pi 4969 Values : [0, 199, 199, 243.58, 13.4, 0, 0, 0, 0, 0, 0]
2016-05-07 02:19:07,694 INFO RFM2Pi Publishing: emonhub/rx/5/values 0,199,199,243.58,13.4,0,0,0,0,0,0
2016-05-07 02:19:07,695 INFO RFM2Pi Publishing: emonhub/rx/5/rssi 0
2016-05-07 02:19:07,697 DEBUG RFM2Pi 4969 adding frame to buffer => [1462587547, 5, 0, 199, 199, 243.58, 13.4, 0, 0, 0, 0, 0, 0]
2016-05-07 02:19:07,697 DEBUG RFM2Pi 4969 Sent to channel’ : ToEmonCMS
2016-05-07 02:19:12,627 DEBUG RFM2Pi 4970 NEW FRAME : OK 5 0 0 197 0 197 0 36 95 134 0 0 0 0 0 0 0 0 0 0 0 0 0 0 0 (-0)
2016-05-07 02:19:12,630 DEBUG RFM2Pi 4970 Timestamp : 1462587552.63
2016-05-07 02:19:12,631 DEBUG RFM2Pi 4970 From Node : 5
2016-05-07 02:19:12,631 DEBUG RFM2Pi 4970 Values : [0, 197, 197, 243.56, 13.4, 0, 0, 0, 0, 0, 0]
2016-05-07 02:19:12,632 INFO RFM2Pi Publishing: emonhub/rx/5/values 0,197,197,243.56,13.4,0,0,0,0,0,0
2016-05-07 02:19:12,634 INFO RFM2Pi Publishing: emonhub/rx/5/rssi 0
2016-05-07 02:19:12,636 DEBUG RFM2Pi 4970 adding frame to buffer => [1462587552, 5, 0, 197, 197, 243.56, 13.4, 0, 0, 0, 0, 0, 0]
2016-05-07 02:19:12,636 DEBUG RFM2Pi 4970 Sent to channel’ : ToEmonCMS
2016-05-07 02:19:17,684 DEBUG RFM2Pi 4971 NEW FRAME : OK 5 0 0 195 0 195 0 57 95 134 0 0 0 0 0 0 0 0 0 0 0 0 0 0 0 (-0)
2016-05-07 02:19:17,687 DEBUG RFM2Pi 4971 Timestamp : 1462587557.68
2016-05-07 02:19:17,687 DEBUG RFM2Pi 4971 From Node : 5
2016-05-07 02:19:17,688 DEBUG RFM2Pi 4971 Values : [0, 195, 195, 243.77, 13.4, 0, 0, 0, 0, 0, 0]
2016-05-07 02:19:17,689 INFO RFM2Pi Publishing: emonhub/rx/5/values 0,195,195,243.77,13.4,0,0,0,0,0,0
2016-05-07 02:19:17,690 INFO RFM2Pi Publishing: emonhub/rx/5/rssi 0
2016-05-07 02:19:17,692 DEBUG RFM2Pi 4971 adding frame to buffer => [1462587557, 5, 0, 195, 195, 243.77, 13.4, 0, 0, 0, 0, 0, 0]
2016-05-07 02:19:17,693 DEBUG RFM2Pi 4971 Sent to channel’ : ToEmonCMS
2016-05-07 02:19:22,625 DEBUG RFM2Pi 4972 NEW FRAME : OK 5 0 0 193 0 193 0 245 94 134 0 0 0 0 0 0 0 0 0 0 0 0 0 0 0 (-0)
2016-05-07 02:19:22,628 DEBUG RFM2Pi 4972 Timestamp : 1462587562.63
2016-05-07 02:19:22,628 DEBUG RFM2Pi 4972 From Node : 5
2016-05-07 02:19:22,629 DEBUG RFM2Pi 4972 Values : [0, 193, 193, 243.09, 13.4, 0, 0, 0, 0, 0, 0]
2016-05-07 02:19:22,630 INFO RFM2Pi Publishing: emonhub/rx/5/values 0,193,193,243.09,13.4,0,0,0,0,0,0
2016-05-07 02:19:22,631 INFO RFM2Pi Publishing: emonhub/rx/5/rssi 0
2016-05-07 02:19:22,633 DEBUG RFM2Pi 4972 adding frame”

BTE - the uart-usb card has lost its plastic female part to the emonTx, so I will have to extract it from the emonTx.

the emonhub.log doesn’t show anything specific and the absence of the emonTx node will only have significance if we can confirm it should be there from the serial output and LED activity[quote=“pb66, post:2, topic:247”]
Does the LED on the emonTx continue to flash every ~10s after the initial setup?
[/quote]

When you say [quote=“rwpjones, post:7, topic:247”]
Well, now I don’t get anything from the emonTx serial port
[/quote]

Are you saying the emonTx is not showing any signs of life at all after startup or is it just a programmer/connection issue?

If there is no serial or led activity, there is unlikely to be much activity of interest in the emonhub.logs.

If you are still seeing an initial packet when the emontx is started then [quote=“pb66, post:4, topic:247”]
can you restart the emonTx and post the log showing that first packet and the following 20 to 30secs?
[/quote]

Restarted several times. red led comes on continuously, thne rapid flashing (about 9-10 times) then every 10-13 seconds.

Serial port activity renewed after plugging into a differnt usb port on my PC.

this is what it looks like

emonTx V3.4 Discrete Sampling V2.30 RFM69CW
OpenEnergyMonitor.org
POST…wait 10s
CT 1 Cal 90.90
CT 2 Cal 90.90
CT 3 Cal 90.90
CT 4 Cal 16.67
RMS Voltage on AC-AC is: ~247V
AC-AC detected - Real Power measure enabled
assuming pwr from AC-AC (jumper closed)
Vcal: 268.97
Phase Shift: 1.70
CT 1 detected
CT 2 detected
No temperature sensor
RFM69CW
Node: 8 Freq: 433Mhz Network: 210
CT1 CT2 CT3 CT4 VRMS/BATT PULSE
0 10 0 0 24681 1
0 9 0 0 24670 1
0 9 0 0 24689 1
0 6 0 0 24692 1
0 7 0 0 24710 1
0 10 0 0 24697 1
0 9 0 0 24692 1
0 11 0 0 24700 1
0 9 0 0 24680 1
0 5 0 0 24686 1
0 5 0 0 24696 1
0 4 0 0 24663 1
0 5 0 0 24688 1
0 4 0 0 24698 1
0 6 0 0 24702 1
0 5 0 0 24714 1
0 4 0 0 24705 1
0 4 0 0 24700 1

Ok that all looks good, having now established the emonTx is alive and kicking, can you see any node 8 activity in emonhub.log whilst the LED on the emonTx continues to flash?

If there isn’t any node 8 activity can you please confirm whether you are still seeing the initial packet when starting the emonTx or not, and if so can we please see an excerpt from emonhub.log showing one of those initial packets and the following 20-30secs or so?

Can you also show us the emonhub.conf for node 8, and whether this has ever worked?

Hi Paul

Thanks for your attention and help.

  1. yes it did work before

  2. here is node 8 from the emonhub.conf file, which I have never altered

[[8]]
nodename = emontx3
[[[rx]]]
names = power1, power2, power3, power4, vrms, temp1, temp2, temp3, temp4, temp5, temp6, pulse
datacodes = h,h,h,h,h,h,h,h,h,h,h,L
scales = 1,1,1,1,0.01,0.1,0.1, 0.1,0.1,0.1,0.1,1
units =W,W,W,W,V,C,C,C,C,C,C,p

  1. I have already posted what I get using “tail …”, and reported that it is the same as in "emonhub.log view. There is something wrong here as you can see from the time - it is not reporting more recent events. If I navigate to /var/log/emonhub I see that the emonhub.log file (and emonhub.log.1) files are more recent (up to date). I am afraid it is a long time since I did any Unix and can’t recall how to access these files from windows. If you let me know how to get them to you that might be a good thing to do.

The emonhub.log files can be up to 5mb in size, way to big to be uploading here or even to sift through.

If you instigate a tail -f /var/log/emonhub/emonhub.log in a terminal session window and then restart the emonTx you should see that initial post being processed, wait for 30 secs or so after any node 8 entries have passed and then use ctrl-c to end the log tail. Select from a couple of lines before the “initial packet” to the end of the valid section and copy&paste from the terminal window into a text file to upload or if it’s not too big paste it straight into a forum post.

Hi Paul

Well, I did manage to edit the log file. Despite several restarts to emontx there was only one entry referring to node 8

2016-05-06 20:28:24,574 DEBUG RFM2Pi 421 Timestamp : 1462566504.57
2016-05-06 20:28:24,592 DEBUG RFM2Pi 421 From Node : 8
2016-05-06 20:28:24,593 DEBUG RFM2Pi 421 Values : [10, 0, 0, 0, 0, 0, 0, 0, 0, 0, 0, 0]
2016-05-06 20:28:24,594 DEBUG RFM2Pi 421 RSSI : -86
2016-05-06 20:28:24,594 INFO RFM2Pi Publishing: emonhub/rx/8/values 10,0,0,0,0,0,0,0,0,0,0,0
2016-05-06 20:28:24,596 INFO RFM2Pi Publishing: emonhub/rx/8/rssi -86
2016-05-06
20:28:24,597 DEBUG RFM2Pi 421 adding frame to buffer =>
[1462566504, 8, 10, 0, 0, 0, 0, 0, 0, 0, 0, 0, 0, 0, -86]
2016-05-06 20:28:24,598 DEBUG RFM2Pi 421 Sent to channel’ : ToEmonCMS
2016-05-06 20:28:27,830 DEBUG RFM2Pi 422 NEW FRAME : OK 5 0 0 22 1 22 1 171 95 151 0 0 0 0 0 0 0 0 0 0 0 0 0 0 0 (-0)
2016-05-06 20:28:27,833 DEBUG RFM2Pi 422 Timestamp : 1462566507.83
2016-05-06 20:28:27,834 DEBUG RFM2Pi 422 From Node : 5
2016-05-06 20:28:27,834 DEBUG RFM2Pi 422 Values : [0, 278, 278, 244.91, 15.100000000000001, 0, 0, 0, 0, 0, 0]
2016-05-06 20:28:27,835 INFO RFM2Pi Publishing: emonhub/rx/5/values 0,278,278,244.91,15.1,0,0,0,0,0,0
2016-05-06 20:28:27,836 INFO RFM2Pi Publishing: emonhub/rx/5/rssi 0
and that is is, between 2016-05-06 19:46:36, and 2016-05-07 02:19:22,Does this help?

I restarted both by pressing the reset button, and powering off and then on.
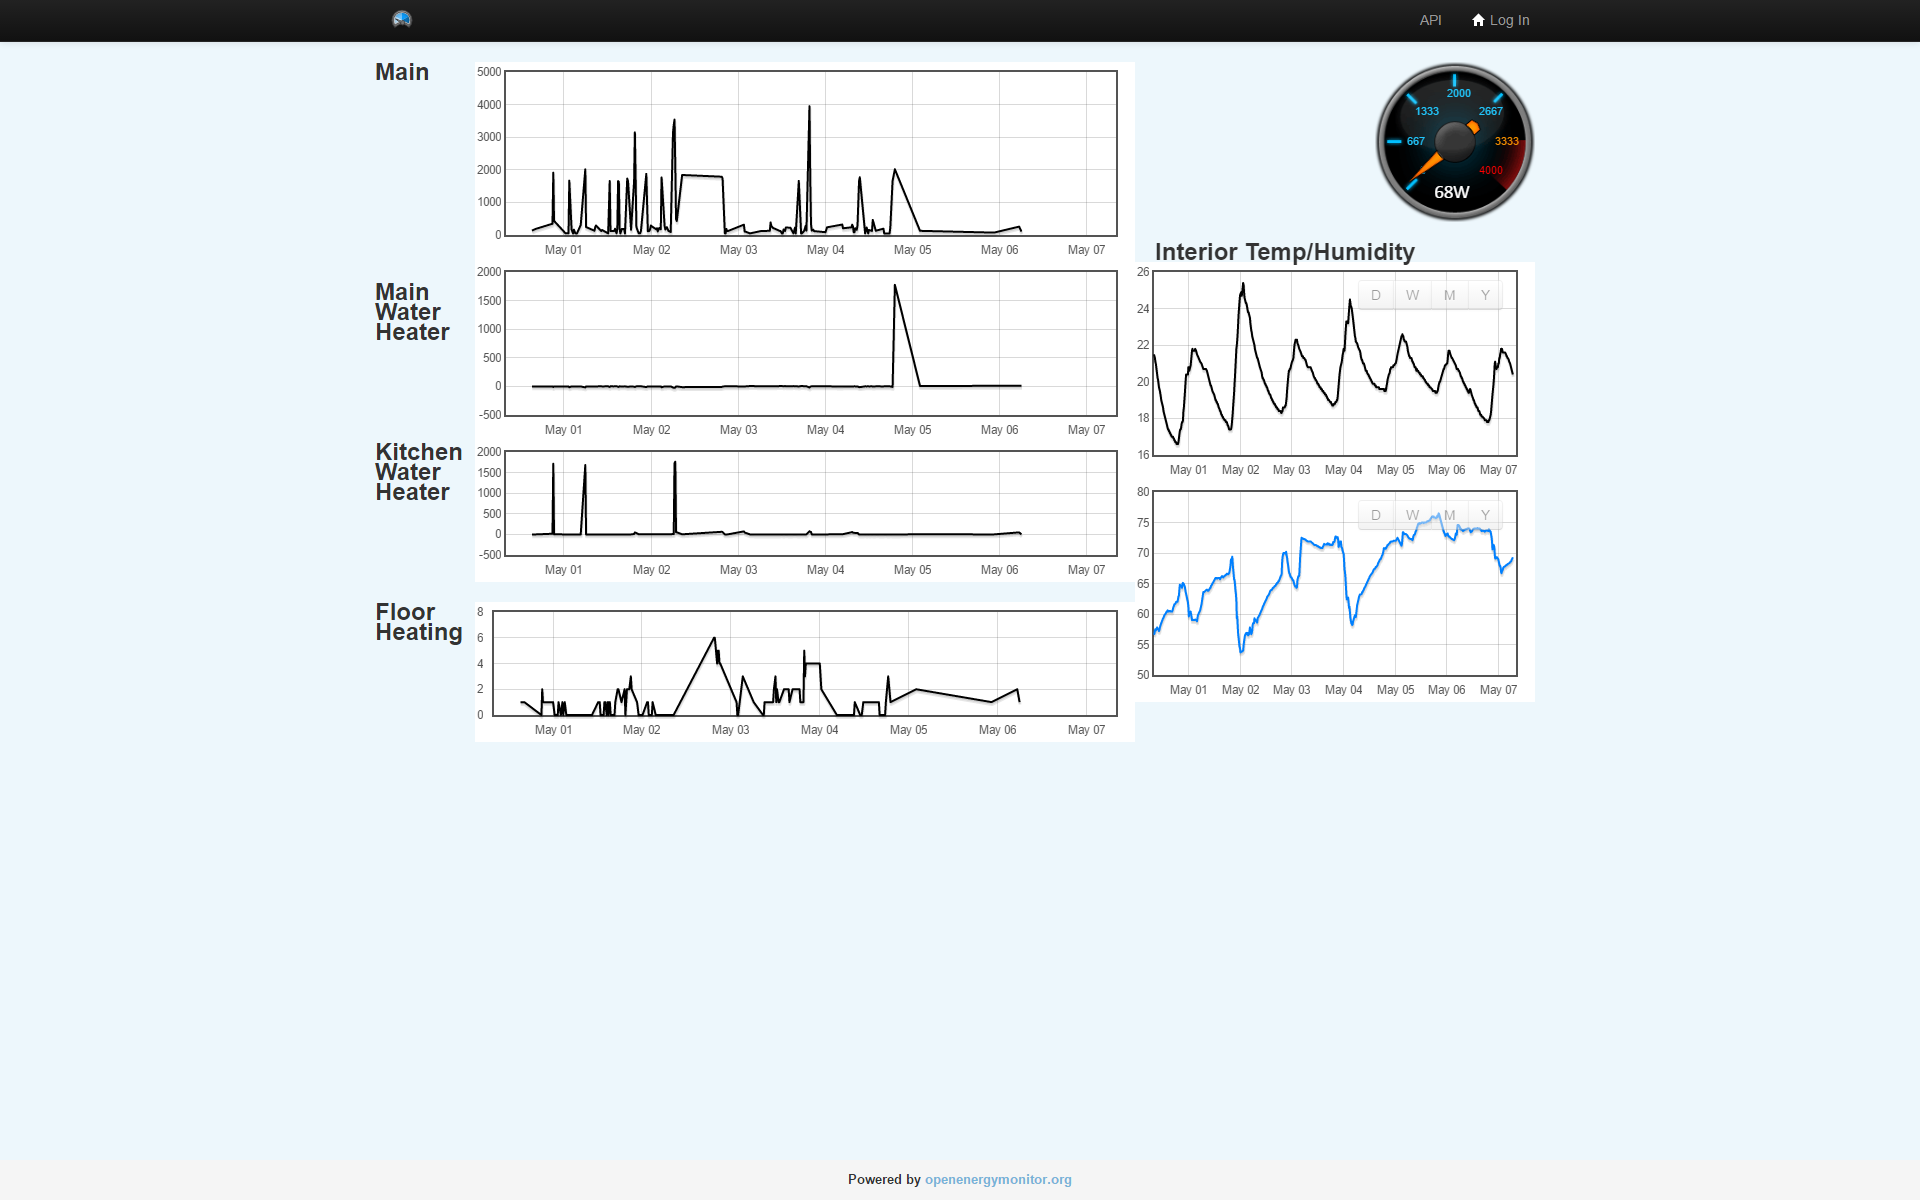
This is what I get:

pi@emonpi ~ $ tail -f /var/log/emonhub/emonhub.log -n 20
2016-05-07 02:19:12,631 DEBUG RFM2Pi 4970 Values : [0, 197, 197, 243.56, 13.4, 0, 0, 0, 0, 0, 0]
2016-05-07 02:19:12,632 INFO RFM2Pi Publishing: emonhub/rx/5/values 0,197,197,243.56,13.4,0,0,0,0,0,0
2016-05-07 02:19:12,634 INFO RFM2Pi Publishing: emonhub/rx/5/rssi 0
2016-05-07 02:19:12,636 DEBUG RFM2Pi 4970 adding frame to buffer => [1462587552, 5, 0, 197, 197, 243.56, 13.4, 0, 0, 0, 0, 0, 0]
2016-05-07 02:19:12,636 DEBUG RFM2Pi 4970 Sent to channel’ : ToEmonCMS
2016-05-07 02:19:17,684 DEBUG RFM2Pi 4971 NEW FRAME : OK 5 0 0 195 0 195 0 57 95 134 0 0 0 0 0 0 0 0 0 0 0 0 0 0 0 (-0)
2016-05-07 02:19:17,687 DEBUG RFM2Pi 4971 Timestamp : 1462587557.68
2016-05-07 02:19:17,687 DEBUG RFM2Pi 4971 From Node : 5
2016-05-07 02:19:17,688 DEBUG RFM2Pi 4971 Values : [0, 195, 195, 243.77, 13.4, 0, 0, 0, 0, 0, 0]
2016-05-07 02:19:17,689 INFO RFM2Pi Publishing: emonhub/rx/5/values 0,195,195,243.77,13.4,0,0,0,0,0,0
2016-05-07 02:19:17,690 INFO RFM2Pi Publishing: emonhub/rx/5/rssi 0
2016-05-07 02:19:17,692 DEBUG RFM2Pi 4971 adding frame to buffer => [1462587557, 5, 0, 195, 195, 243.77, 13.4, 0, 0, 0, 0, 0, 0]
2016-05-07 02:19:17,693 DEBUG RFM2Pi 4971 Sent to channel’ : ToEmonCMS
2016-05-07 02:19:22,625 DEBUG RFM2Pi 4972 NEW FRAME : OK 5 0 0 193 0 193 0 245 94 134 0 0 0 0 0 0 0 0 0 0 0 0 0 0 0 (-0)
2016-05-07 02:19:22,628 DEBUG RFM2Pi 4972 Timestamp : 1462587562.63
2016-05-07 02:19:22,628 DEBUG RFM2Pi 4972 From Node : 5
2016-05-07 02:19:22,629 DEBUG RFM2Pi 4972 Values : [0, 193, 193, 243.09, 13.4, 0, 0, 0, 0, 0, 0]
2016-05-07 02:19:22,630 INFO RFM2Pi Publishing: emonhub/rx/5/values 0,193,193,243.09,13.4,0,0,0,0,0,0
2016-05-07 02:19:22,631 INFO RFM2Pi Publishing: emonhub/rx/5/rssi 0
2016-05-07 02:19:22,633 DEBUG RFM2Pi 4972 adding frame
pi@emonpi ~ $ tail -f /var/log/emonhub/emonhub.log -n 20
2016-05-07 02:19:12,631 DEBUG RFM2Pi 4970 Values : [0, 197, 197, 243.56, 13.4, 0, 0, 0, 0, 0, 0]
2016-05-07 02:19

Richard

These 2 lines tell us a lot, unfortunately what it tells us doesn’t make a lot of sense right now, but it explains why the packets are failing to make it all the way to emonhub so that we can at least see them to debug. All those zero’s will be causing “bit-slip” and the packet can be mis-read and assumed corrupt, at which time it is discarded by the emonPi.

This isn’t going to be easy to debug as the emonPi will not run in non-quiet mode so those discarded packets can be seen, so hopefully the problem will get resolved in one hit and not need much debugging.

So the root cause will be the cause of all the zeros, that is the strange part, the first 4 values are Power values and are not usually enough zeros to trigger the issue alone, the next value should be the ac voltage, why that is missing I have no idea since it is both recognized and reported as ~246v in the serial prints, as for the next 6 values after that should all be 300 if the serial print is to believed and you have no temp sensors attached to the emonTx (300 = absent temp sensor).

So that line should have been something like
2016-05-06 20:28:24,593 DEBUG RFM2Pi 421 Values : [10, 0, 0, 0, 246, 300, 300, 300, 300, 300, 300, 0]
This clearly points at an issue within the emonTx. Have you made any changes to the emonTx sketch?

“Bit slippage” sounds nasty!

I have made no changes to any sketch. Over my pay grade. The problem occurred suddenly. As far as I know never reverted.

Should I try to reload the sketch? Presumably this is a standard one I can get form GitHub?

By the way I have parallel problem that the emonPi will not run a firmware update because the file system is read only. Glyn was attending to this but we don’t seem to have reached a conclusion. I am reluctant to reset to rw in part because is not clear to which folder(s) to apply rw.

At this point it may be better to focus on just the temp sensor zero’s rather than the VAC, the fact the VAC was zero on one packet only is not conclusive, the VAC is measured and updated during every interval so even if there was a “glitch” it should be overwritten with the next reading, it reports 0 rather than “230” so it could be that at that particular point in time the AC wasn’t connected as the programmer was connected or something. I assume the TX is normally AC powered and there is no batteries or 5vdc mini usb or programmer attached?

With regard to the temp sensors the value of 300 is set at start up for each of the 6 variables and then the sketch goes on it’s merry way, if anything occurs to any of those variables they will never return to 300 unles the emonTx is restarted so I guess it could be a possible memory overflow or a glitch in the 1-wire library or implementation.

My original request to add the 300 fault condition was not to just add it at setup() but to change the way the value is returned, so rather than

for(byte j=0;j<MaxOnewire;j++) 
      emontx.temp[j] = 3000;                             // If no temp sensors connected default to status code 3000 
                                                         // will appear as 300 once multipled by 0.1 in emonhub

in the setup() setting the values to “300” once only, the “300” should be added by the get_temperature() function so that it applies to every read of the temp sensors

int get_temperature(byte sensor)                
{
  float temp=(sensors.getTempC(allAddress[sensor]));
  if ((temp<125.0) && (temp>-55.0)) return(temp*10); else return 3000;            //if reading is within range for the sensor convert float to int ready to send via RF or value = 300 if not
}

in fact, I recommended the additional use of

for(byte i=0;i<MaxOnewire;i++) emontx.temp[i]=3010; // set all temp values to 301°c (301= never found & 300 = lost or out of scope)

in setup(), So that we could distinguish between “never seen”(301) and “gone faulty”(300) sensors. but the main “fix” was the modified function.

If this method was used the temp sensor value would only ever be zero if the temperature was actually 0 and if there was a glitch at any time the situation would be reassessed every read so that what ever value was presented is in fact current and not the result of a past incident.

This would avoid the “bitslip” which is it’s intention but it will not cure the root issue here, “something” is causing those 6 original values of 300 to vanish, reset or be set to 0.

see Re: Data loss due to RF packets getting corrupted for the original discussion about the “bitslip” issue.

Hi Richard
I’m not sure what to recommend, you could try reloading the sketch but I seee no reason why it should change anything as you are running the latest FW.
I have posted some thoughts on some changes that should be considered for the sketch but the root cause is still a bit of a mystery.
You could try reloading and if that doesn’t work we could try editing a sketch for you with the changes I mentioned, that may then allow the emonTX to at least recover from whatever the root cause is and perhaps reveal some further detail?

Can you link to the update issue thread? The setting of write mode for editing is a global setting done with the rpi-rw command to put the system in a temporary state to write mode to allow controlled edits etc.

@pb66:
This doesn’t cater for the “85.0” reading you get from a broken wire to the sensor. I’m putting

   if (temp<125.0 && temp>-55.0 && temp!=85.0) …
      else return 3000

into the 3-phase sketch. Hopefully, others will follow :wink:

Well - I have now relocated the emonPi, and am trying to update the emonTx. I don;t have a Pi. How do I load the latest emonTx 3.4 firmware from Windows - presumably through the arduino IDE? Or through Xloader (which the blog says is not tested)?

I will need to download and place the latest firmware in a folder to which the “sketch” is pointed? I’m not sure wha to download from “emonTxFirmware/emonTxV3 at master · openenergymonitor/emonTxFirmware · GitHub” which is the supposed source.

Or do I need to get a Pi and connect it to the emonTx - by wires I presume as shown here- Connect an EmonTx v3 to RaspberryPI via serial | Archived Forum! Not into this yet, but I’m willing to learn…

All help gratefully …

Do you have a programmer to connect from your computer’s USB port to the emonTx’s serial port? If so, the easiest way is via the Arduino IDE, full instructions for W8/W10 are here: Setting up the Arduino Environment for Windows (7, 8.1 & 10) | Archived Forum
You’ll need to get and install some libraries - there’s a link at the bottom of the IDE installation page - and that more-or-less tells you where to put the sketch. It insists on being in a directory of the same name. The one you want is
emonTxFirmware/emonTxV3/RFM/emonTxV3.4/emonTxV3_4_DiscreteSampling at master · openenergymonitor/emonTxFirmware · GitHub
so it has to be in a folder called “emonTxV3_4_DiscreteSampling”