Maybe I need to check myself, but I show EmonHub Failed. I don’t use the emoncms.org service and store my data locally. So, I’m not sure if that is something I should be concerned about. Everything appears to be working.
Hello @Ryan_S do you mean that emonhub is showing as not running in the admin interface? or via SSH?
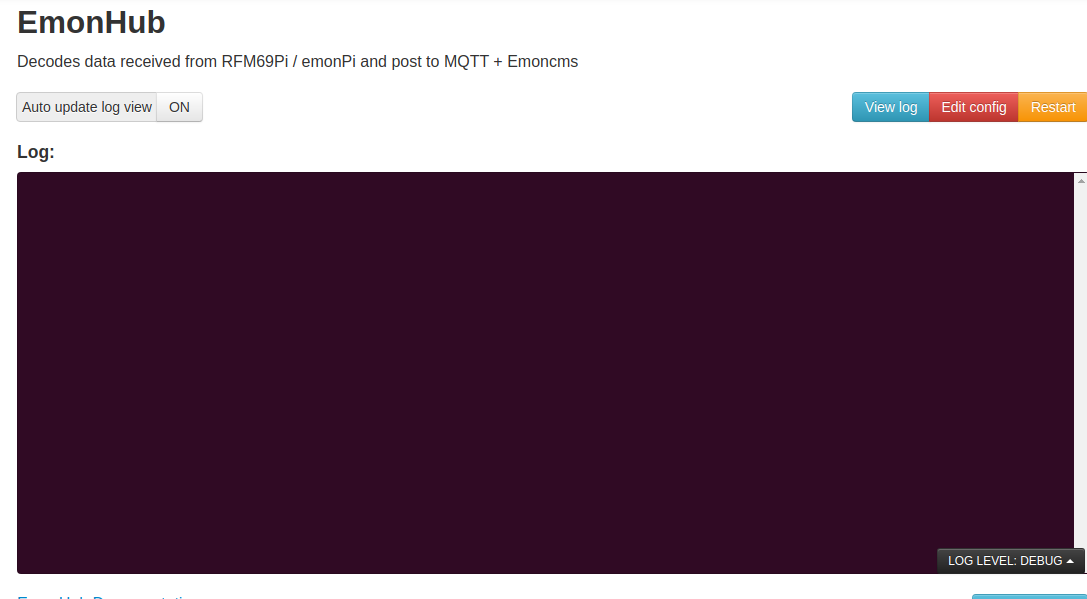
Do you see new entries in the Emonhub log? Setup > Emonhub > View log
According to the Admin space it reports as failed. I’ll include the copy from that to show it.
Under the Emonhub section the log is empty.
Server Information
Server Information
Services
- emonhub :- Failed Failed
- emoncms_mqtt :- Active Running
- feedwriter :- Active Running - sleep 300s 130 feed points pending write
- service-runner :- Active Running
- emonPiLCD :- Failed Failed
- redis-server :- Active Running
- mosquitto :- Active Running
- demandshaper :- Active Running
Emoncms
- Version :- low-write 10.2.5
- Modules :- Administration | App v2.1.6 | Backup v2.2.4 | EmonHub Config v2.0.5 | Dashboard v2.0.8 | DemandShaper v1.2.6 | Device v2.0.6 | EventProcesses | Feed | Graph v2.0.9 | Input | Postprocess v2.1.4 | CoreProcess | Schedule | Network Setup v1.0.0 | sync | Time | User | Visualisation | WiFi v2.0.3
-
Git :-
- URL :- GitHub - emoncms/emoncms: Web-app for processing, logging and visualising energy, temperature and other environmental data
- Branch :- * stable
- Describe :- 10.2.5
Server
- OS :- Linux 4.19.75-v7+
- Host :- emonpi | emonpi | (192.168.1.24)
- Date :- 2020-08-26 09:34:33 BST
- Uptime :- 09:34:33 up 3 days, 11:07, 0 users, load average: 0.00, 0.04, 0.04
Memory
-
RAM :- Used: 17.42%
- Total :- 975.62 MB
- Used :- 169.93 MB
- Free :- 805.69 MB
-
Swap :- Used: 0.00%
- Total :- 100 MB
- Used :- 0 B
-
Free :- 100 MB
Write Load Period
Disk
-
/ :- Used: 52.58%
- Total :- 3.92 GB
- Used :- 2.06 GB
- Free :- 1.67 GB
- Write Load :- n/a
-
/boot :- Used: 20.55%
- Total :- 252.05 MB
- Used :- 51.79 MB
- Free :- 200.26 MB
- Write Load :- 0 B/s (3 days 11 hours 6 mins)
-
/var/opt/emoncms :- Used: 4.63%
- Total :- 9.98 GB
- Used :- 473.01 MB
- Free :- 9.01 GB
- Write Load :- n/a
-
/var/log :- Used: 2.12%
- Total :- 50 MB
- Used :- 1.06 MB
- Free :- 48.94 MB
- Write Load :- n/a
HTTP
- Server :- Apache/2.4.38 (Raspbian) HTTP/1.1 CGI/1.1 80
MySQL
- Version :- 5.5.5-10.3.17-MariaDB-0+deb10u1
- Host :- localhost:6379 (127.0.0.1)
- Date :- 2020-08-26 09:34:33 (UTC 01:00)
- Stats :- Uptime: 299227 Threads: 15 Questions: 703476 Slow queries: 0 Opens: 55 Flush tables: 1 Open tables: 49 Queries per second avg: 2.350
Redis
-
Version :-
- Redis Server :- 5.0.3
- PHP Redis :- 5.0.2
- Host :- localhost:6379
- Size :- 366 keys (837.83K)
- Uptime :- 3 days
MQTT Server
- Version :- Mosquitto 1.5.7
- Host :- localhost:1883 (127.0.0.1)
PHP
- Version :- 7.3.9-1~deb10u1 (Zend Version 3.3.9)
- Modules :- apache2handlercalendar Core ctype curl date dom v20031129exif fileinfo filter ftp gd gettext hash iconv json v1.7.0libxml mbstring mosquitto v0.4.0mysqli mysqlnd vmysqlnd 5.0.12-dev - 20150407 - $Id: 7cc7cc96e675f6d72e5cf0f267f48e167c2abb23 $openssl pcre PDO pdo_mysql Phar posix readline redis v5.0.2Reflection session shmop SimpleXML sockets sodium SPL standard sysvmsg sysvsem sysvshm tokenizer wddx xml xmlreader xmlwriter xsl Zend OPcache zlib
Pi
-
Model :- Raspberry Pi 3 Model B+ Rev 1.3 - 1GB (Sony UK)
-
Serial num. :- 3BD68E61
-
CPU Temperature :- 56.38°C
-
GPU Temperature :- 55.8°C
-
emonpiRelease :- emonSD-17Oct19
-
File-system :- read-only
What is the hardware in use? An emonPi?
I use a Raspberry Pi 3. Which is why I kind of wonder if this is just a normal fault.
Plus an RFM card from the shop?
Nope. Just Raspberry Pi 3. It gets it’s information from Iotawatt and two OpenEVSE’s.
Probably uses MQTT to transfer data, so, no, nothing to worry about.
Most likely, EmonCMS local shows it’s still receiving and recording everything, so didn’t figure it was causing any issues. Most likely it’s reporting failed since it’s not in use.
1 Like