SSL (https) is crashing the ESP but http is OK. I can send an odd SSL API command but it quickly runs out of memory so I’m guessing there’s a memory leak in the code somewhere.
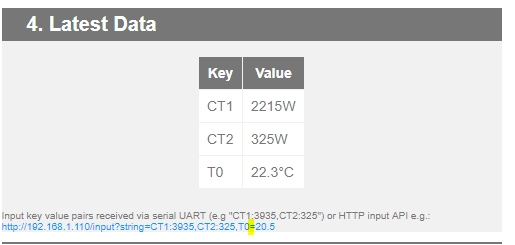
Based on the test API url of http://192.168.1.128/input?string=CT1:3935,CT2:325,T0:20.5 I have the inputs set up as log processes and feeds updating in emoncms. I can also set up gauge and thermometer widgets but I’m not seeing anything in the graphs of the dashboard or the Data Viewer. Is there some kind of averaging taking place and any idea why I don’t see any data?
@glyn.hudson I am still not seeing any data in the Email Reports for daily KWH. How long should it take to see data in the email preview facility and does it matter if there is a break for a few hours in the data streaming i.e. does it need to be a continuous 24 / 48 / 72 hour stream before the data becomes available?
I am a few days into data streaming now so I think I have something set up incorrectly for email reporting.
I will keep an eye on it over the next 48 hours but I wondered how it differed from the dashboard etc.
I have a feed called “KWH” and that is fine for the dashboard and I am also selecting it in the email interface for the following drop down box:
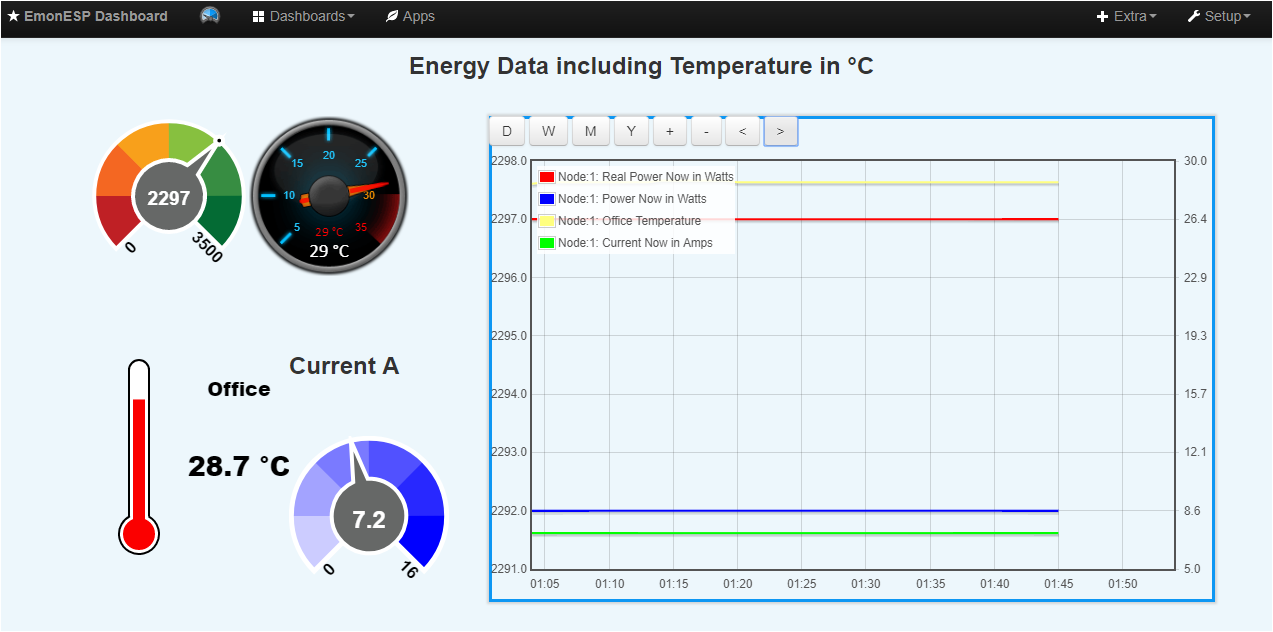
Also now that my datastreams are “live” it’s nice to see the gauges and thermometer moving in “real time” in the dashboard but am I right in thinking the graphs don’t have any automatic scrolling, even if very slowly depending on the granularity?
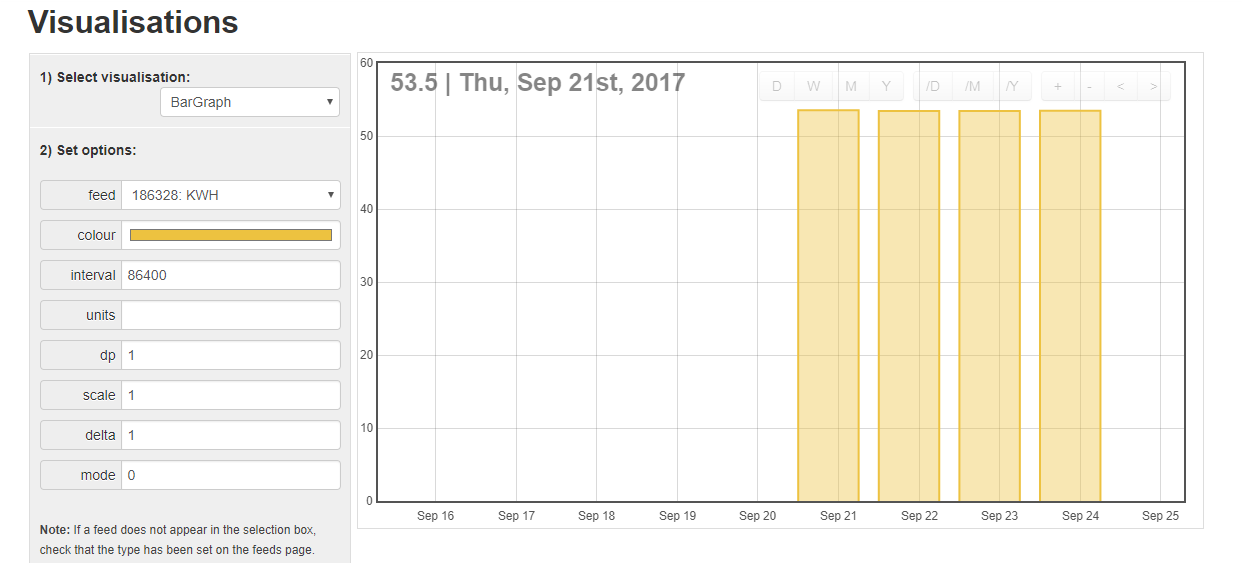
@TrystanLea and @glyn.hudson as per the screenshot below I can get a graph of daily KWH’s (presently simulated until my CT’s arrive) from Visualization.
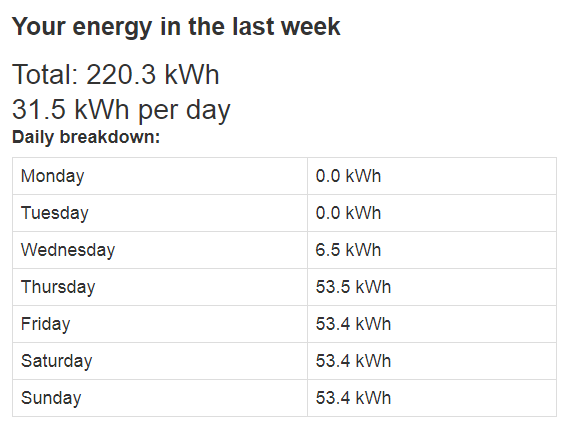
Are you sure it’s a daily report? I have no experience of the email reports myself, but I suspect from what you’ve posted it’s a weekly report of daily data and sent out on the first day of the week with the previous weeks data. hence the data included is for Monday to Sunday including 2 days at 0.0 kWh since you only have data for the proceeding 5 days.
Yes @pb66 looks like that’s how it works so it could take as long as the 8th day before you know it’s working.
I actually received my first email today.
The email system has a “preview” and “test” feature which gives the impression you can see the data before waiting for the email. This is true but it will not show any data until the first week ends.