Hi there, first time starting a thread. Please move this to appropriate place if I’ve posted in the wrong location.
I’m completely replacing Owl Intuition solar PV with emonPi. This involves ditching OWL cloud based collection, instead use emonCMS to collect data. I think I’ve got majority of the feeds setup okay.
EmonCMS then feed into Home Assistant. This directly replaces OWL UDP push functionality. Allows easy monitoring from a central interface.
But OWL also do multicast. There’s an excellent example: intuition-listener.c (owl webpage) Using the multicast listener as baseline, I have written a few little C programs:
generate a simple DyGraph webpage, where another raspberry pi with display will show the graph, on auto-refresh
home automation for plugs, eg only charge my cordless dyson when there is excess power. WOL my PC to start mining
PC also runs the same C program, but tweaked so it will pause CPU and/or GPU mining and may shutdown if excess drops and/or large appliance usage is detected
What is the general wisdom on how to best achieve the above 3 things with emonCMS?
Here is my thoughts:
All 3 should be replaceable with minimal effort using MQTT. But I can’t seem to find good MQTT listener C example similar to the above multicast listener example.
(My programming skills is only hobbyist, okay to re-use code and write some simple logic, but zero idea how websockets etc work. )
Another way of achieving similar goal is to ditch my C program and use newer tools available:
emonCMS already have graphing functionality. But what type of graph is simplest to render? How do I make it available just by accessing a URL? (make a dashboard public?)
Easy to do with Home Assistant automations.
Home Assistant can WOL and shutdown/hibernate PC. It’s not ideal as there is only on/off, it’s a workaround until I can find more suitable substitute.
Even better, any ways to get emonCMS to do multicast?
Hello @wyx087 nice project! Others may be able to help with some of the other items, I think I can help with:
You can create a graph using emoncms > Setup > Visualisations e.g rawdata and then to display without emoncms theme you can add an embed parameter e.g &embed=1
Thanks! I got a graph working and displaying on my display-Pi.
But I can’t seem to find any way to change background colour? The default white is too bright, the display lights up the corner of kitchen like a lamp.
If you can use a multigraph instead, the background is transparent and you can then either set the dashboard page’s background colour for a page wide uniform background or use a text widget box to put an “image” behind the graph. That “image” file could simply be a custom sized block of color created in paint etc.
I am using multigraph, looks like it’s the only one can support 3 feeds: usage, solar and export. But as you’ve said, the background is transparent and it seems by default, an empty page has white background.
My bad, I got it the wrong way round, it’s the graph module that has a transparent background, can you use that?
The graphs module can include as many feeds as you like, just as the multigraph does.
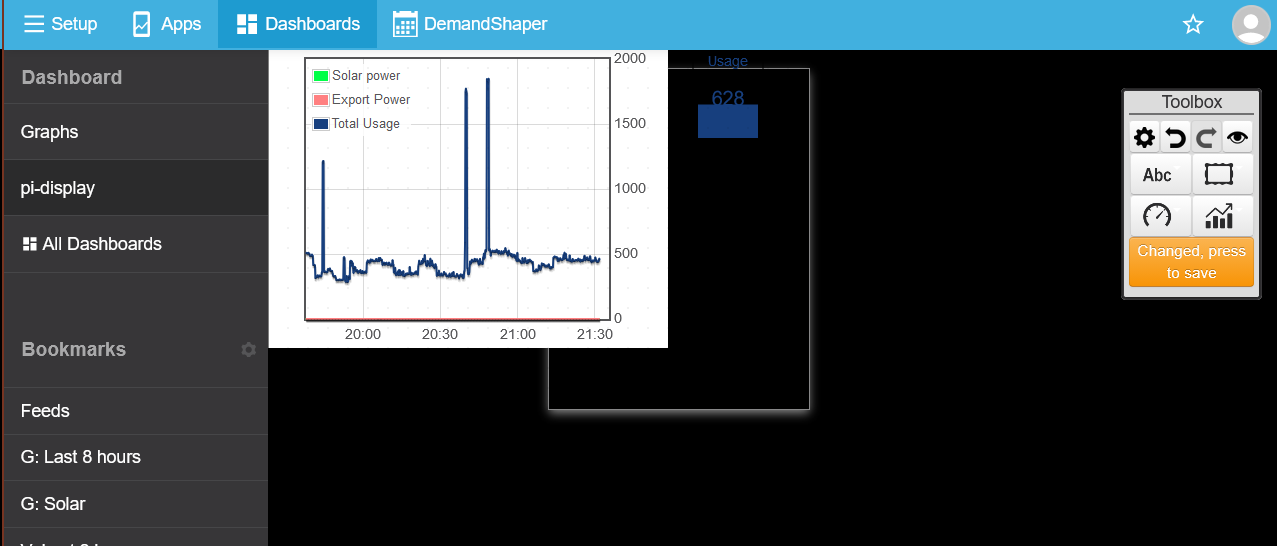
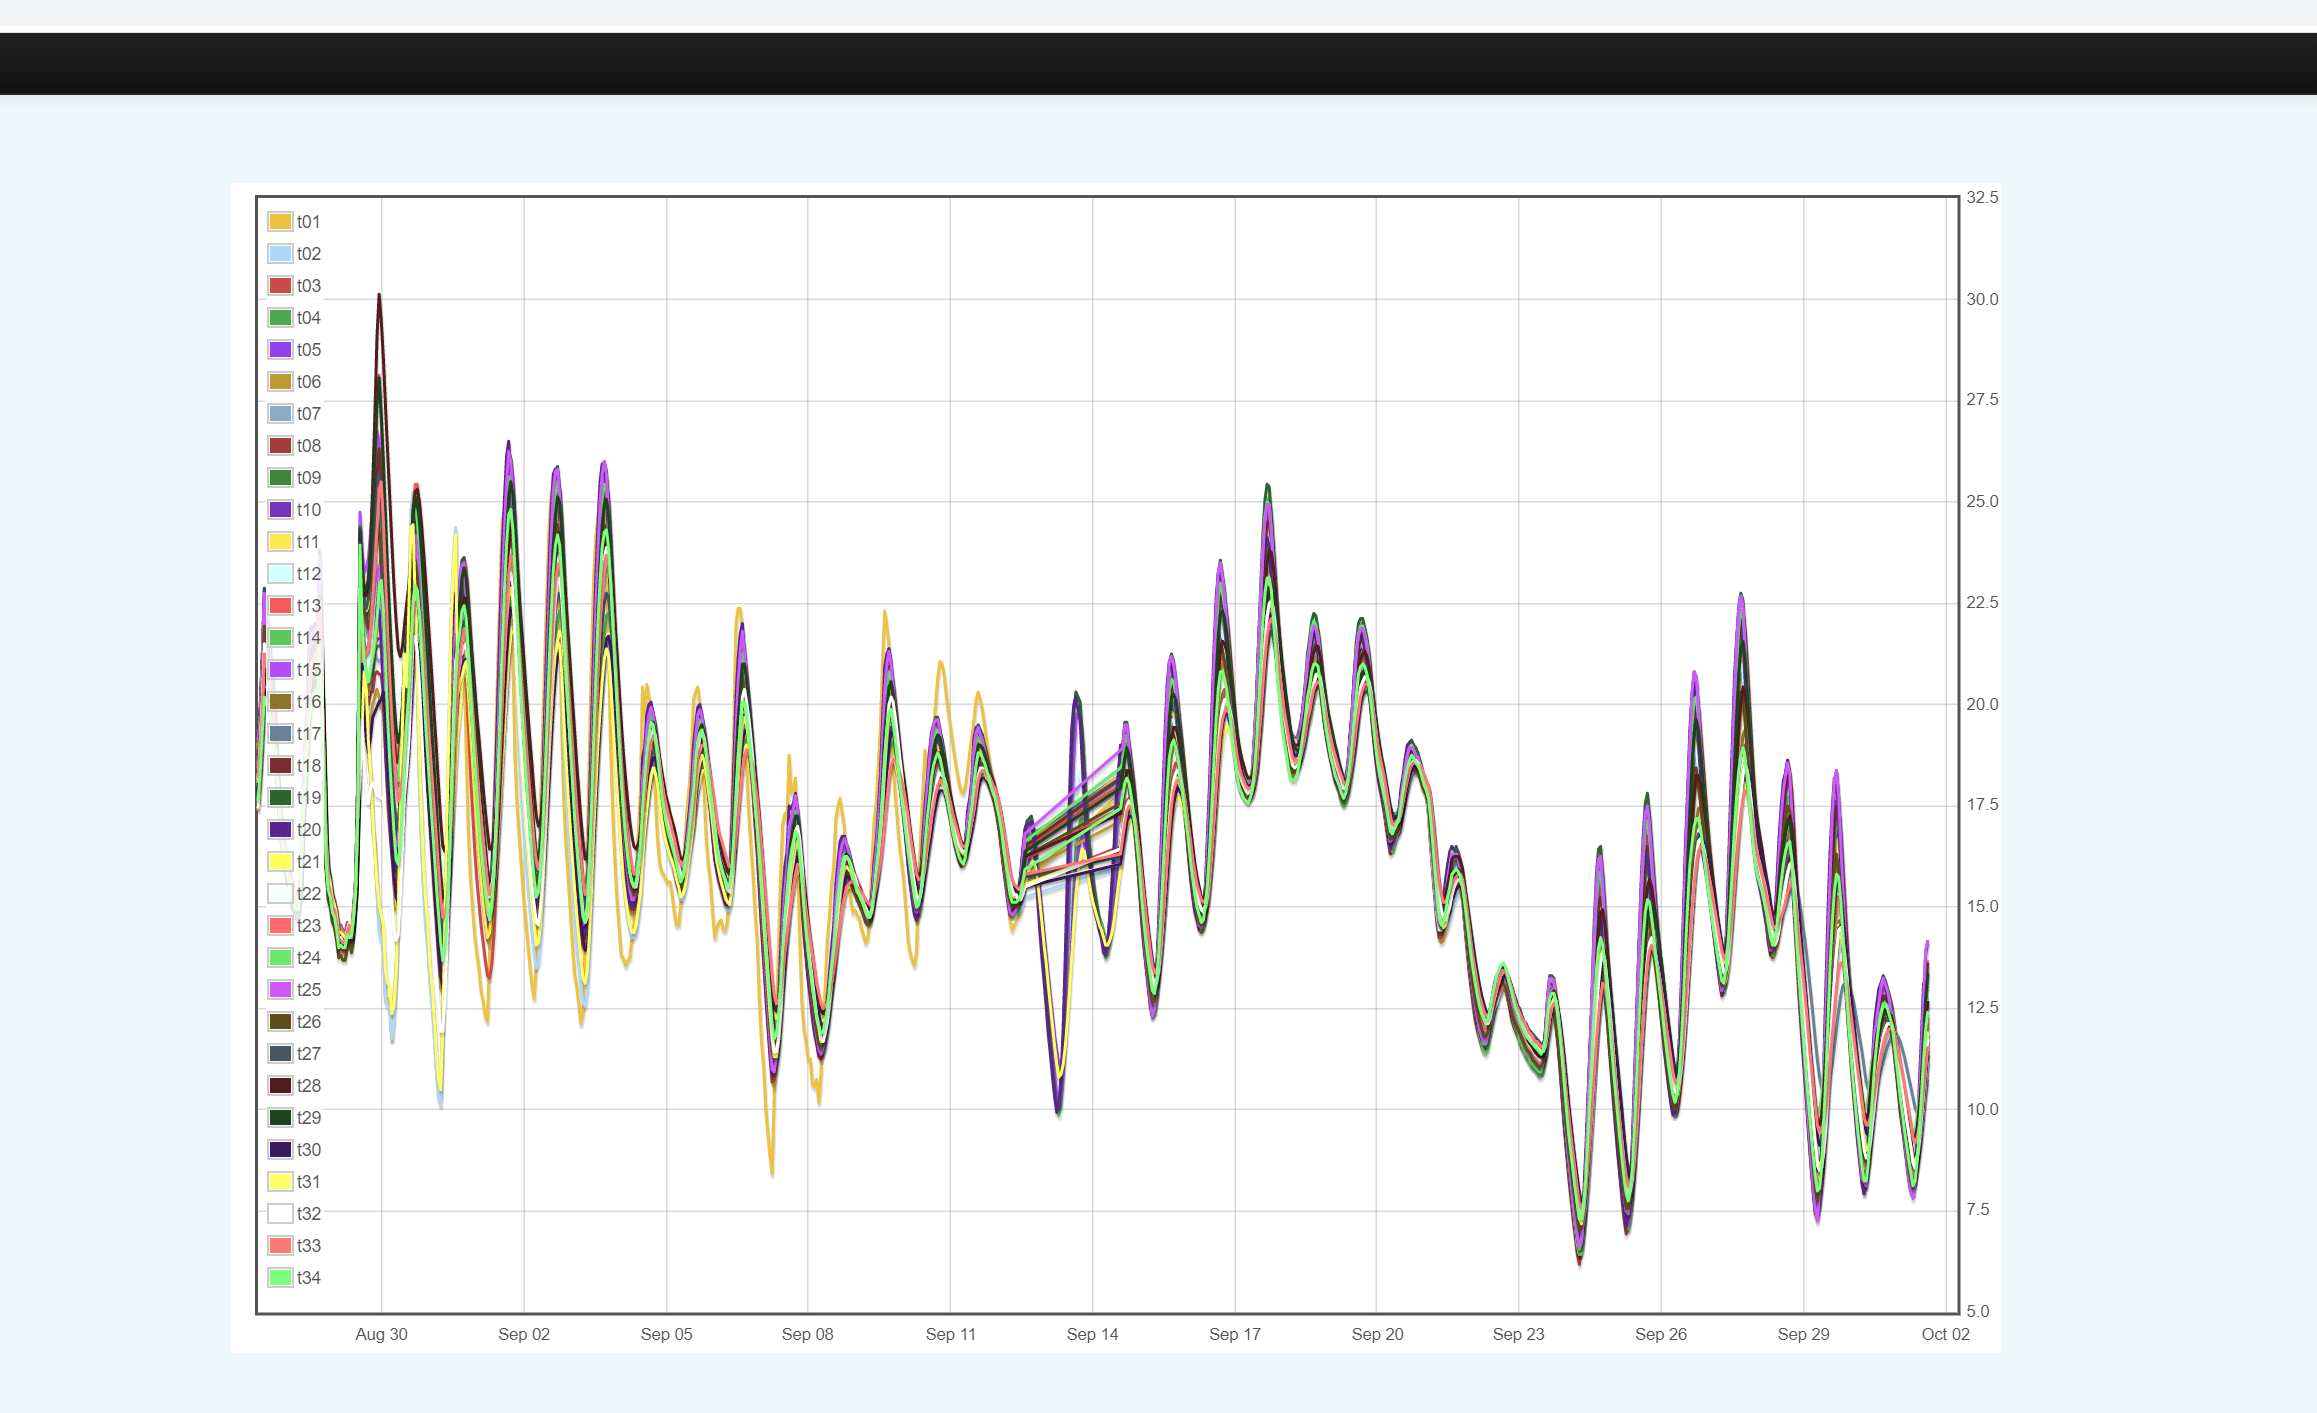
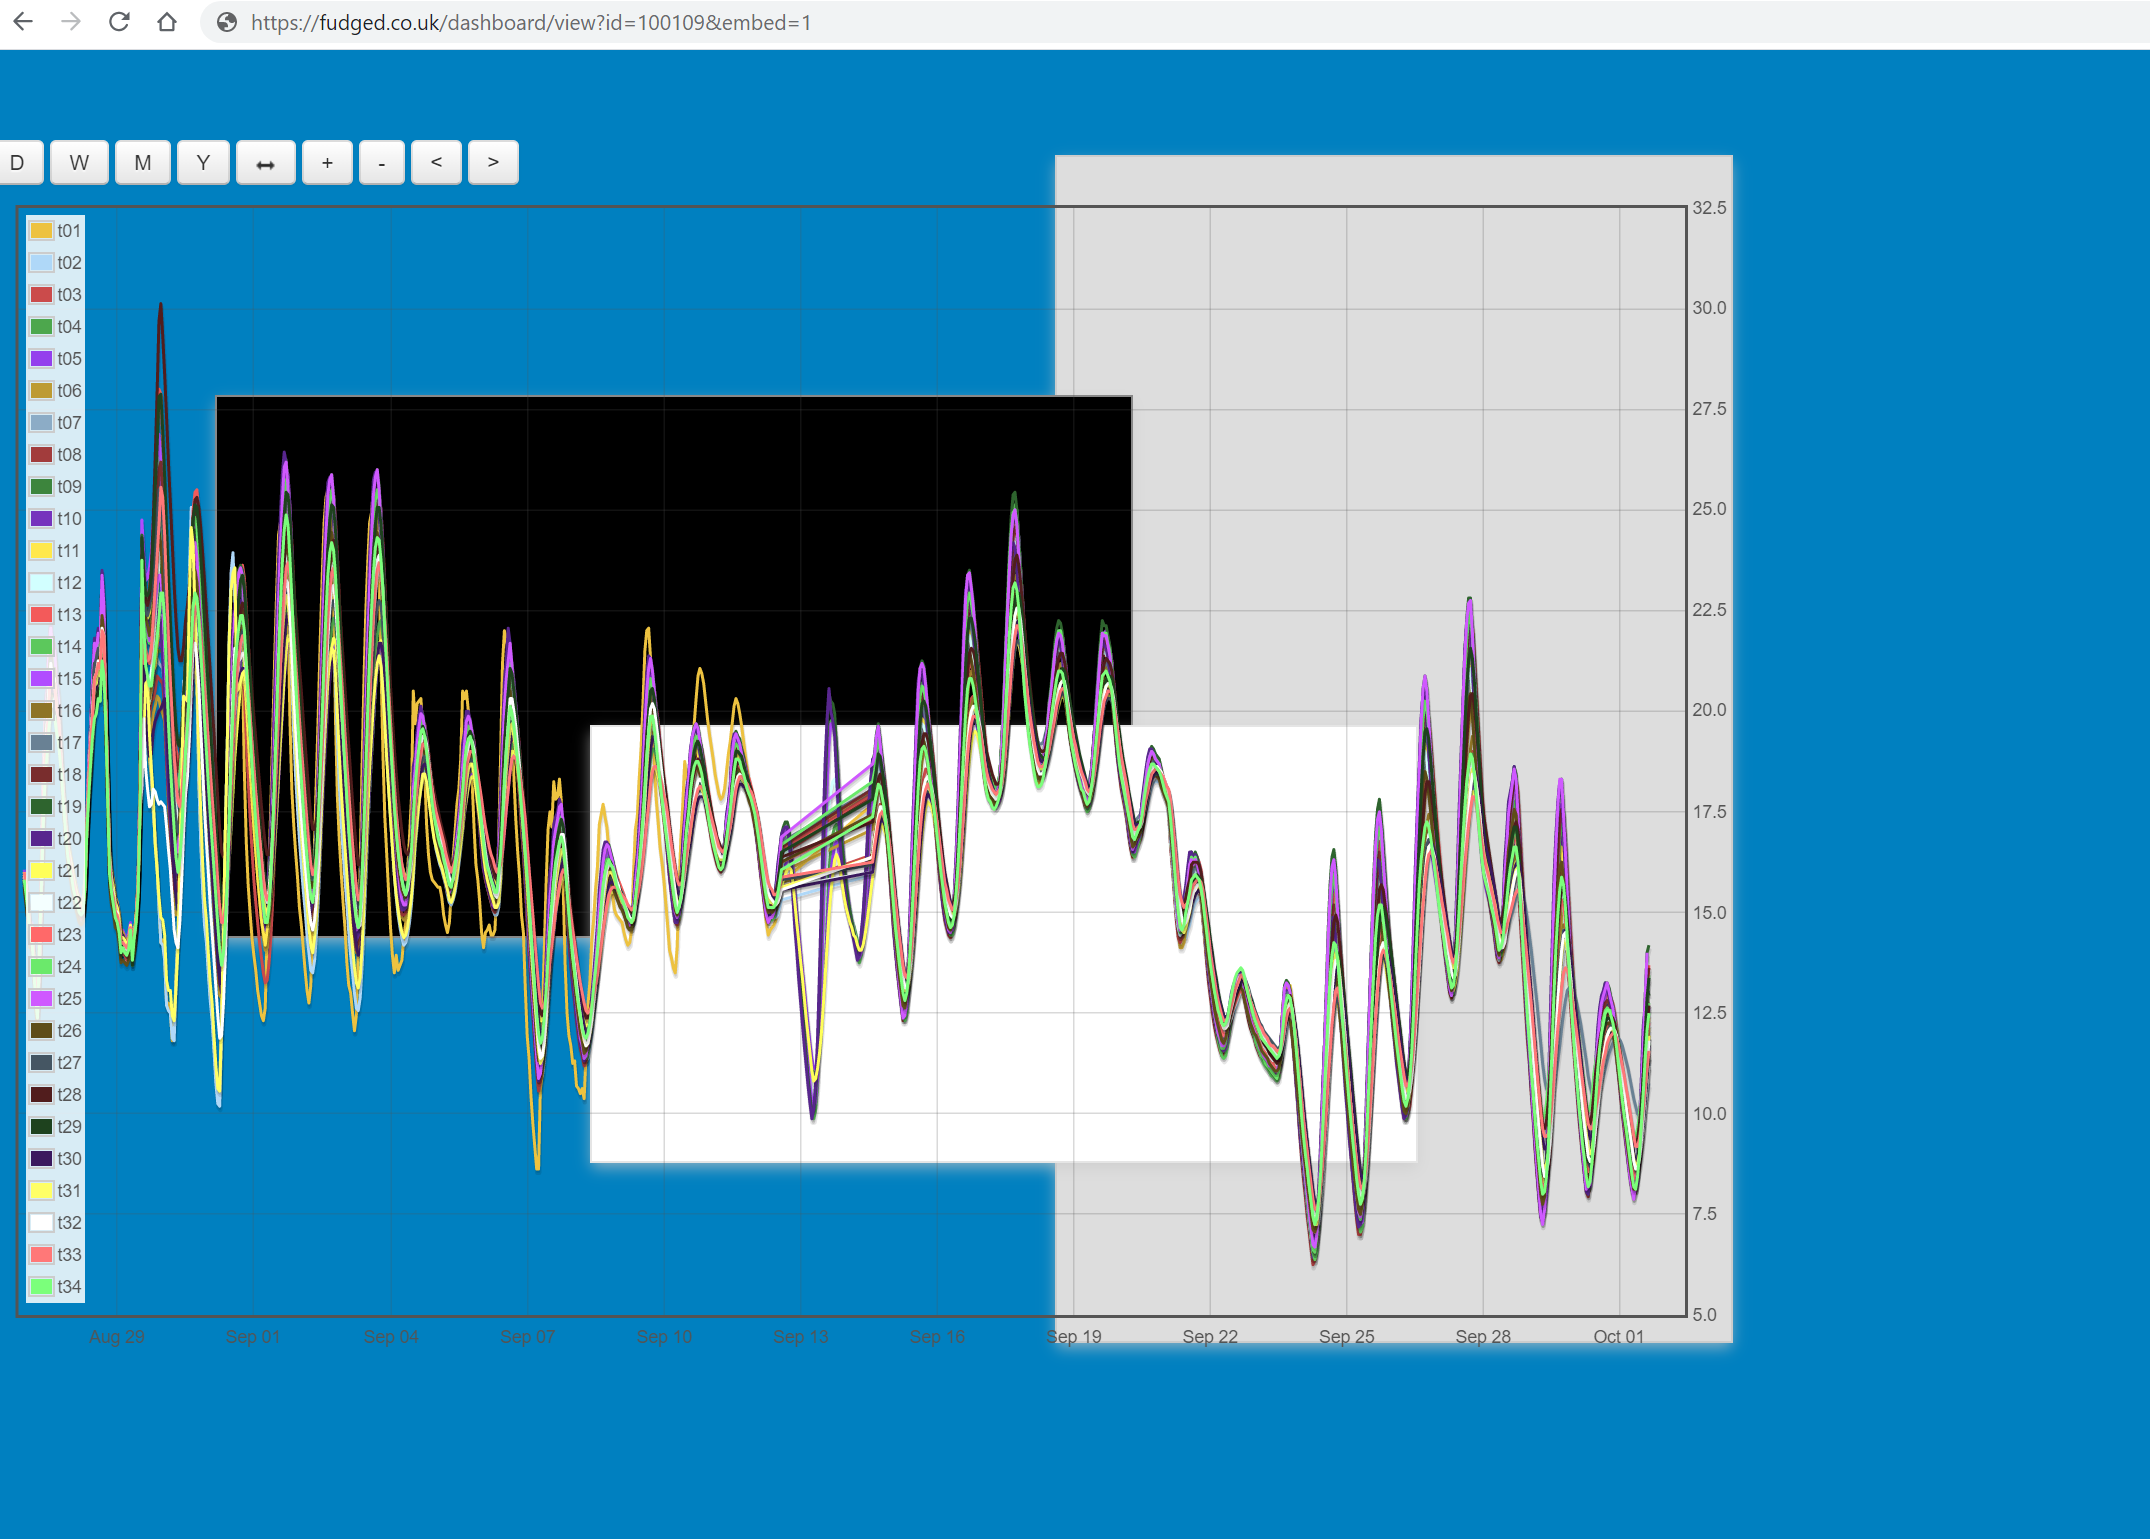
Here’s a couple of old graphs of mine, using the same feed data and on a blank dash page, first one is a multgraph and the second is a “graph” from the graph module. You can clearly see the white background in the first but not the second.
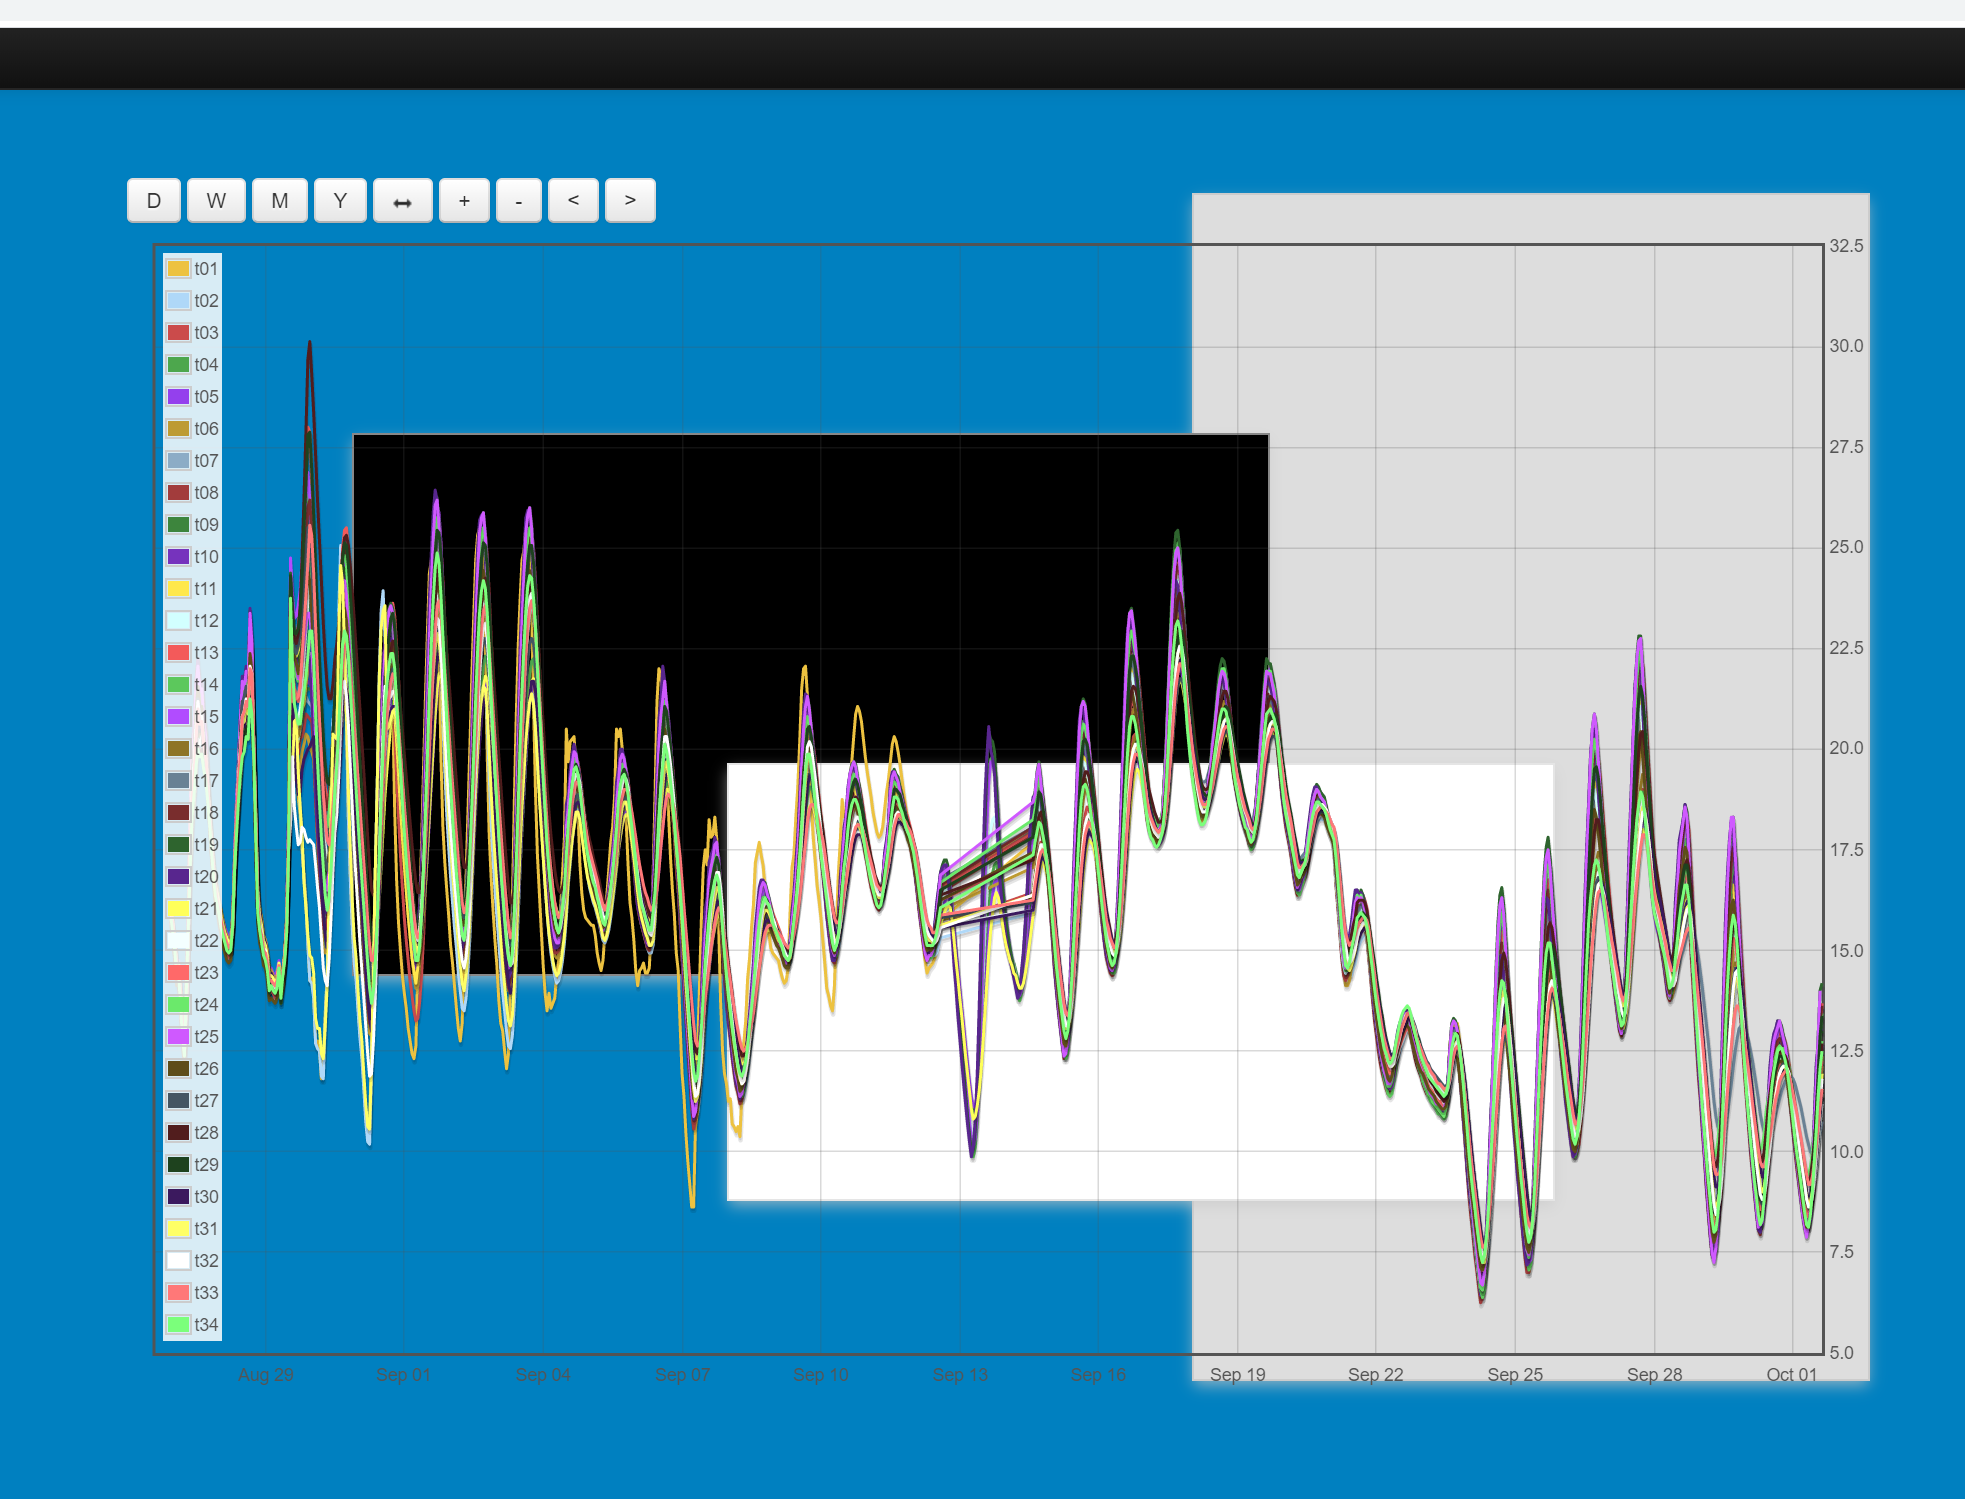
. . . and just to check I’m not nuts! Here is the graph graph again with some colour blocks behind it and the page colour changed to check it’s transparent.
My server isn’t running the latest version so unless something has changed you should be ok to use graph module graphs, however, there’s an unfortunate trade off (unless this has changed recently) as the graph module graphs do not auto-update as the multigraphs do, they are static, so not much cop for an always on display now I think about it!
Thanks for investigating.
I guess the conclusion is that Graphs are static drawn, Visualisations are automatically updated.
I would need Visualisation for always-on display as you’ve pointed out. I’ll live with white background for now because it’s in a pretty much always-lit kitchen. Changing background to dark colour would be a nice-to-have.
You asked why would someone want to use a different graphing app e.g.Grafana.
This is one example. Grafana can be configured for a light or a dark background.
The irony of it is Grafana uses the same “graphing engine” emonCMS uses, i.e. Flot.
I can see benefits to using a different graphing app. I asked why use another DB in the middle in the Grafana thread, when I thought everyone were using same emonCMS on this forum.
It would be great if I can get data off emonCMS directly into Grafana for displaying. Some how?
Plugs automatically turn on/off according to solar production
PC wake, sleep or pause according to solar production
Simple display for solar
Long term logging in exact same format as before (though this is already done much better by emonCMS)
Everything back to exactly same as with OWL, I don’t use OWL dashboard and I’ll probably not access emonCMS on regular basis. So there’s pretty much zero noticeable difference. It’s just as I wanted.


 That background colour configuration feature is still needed.