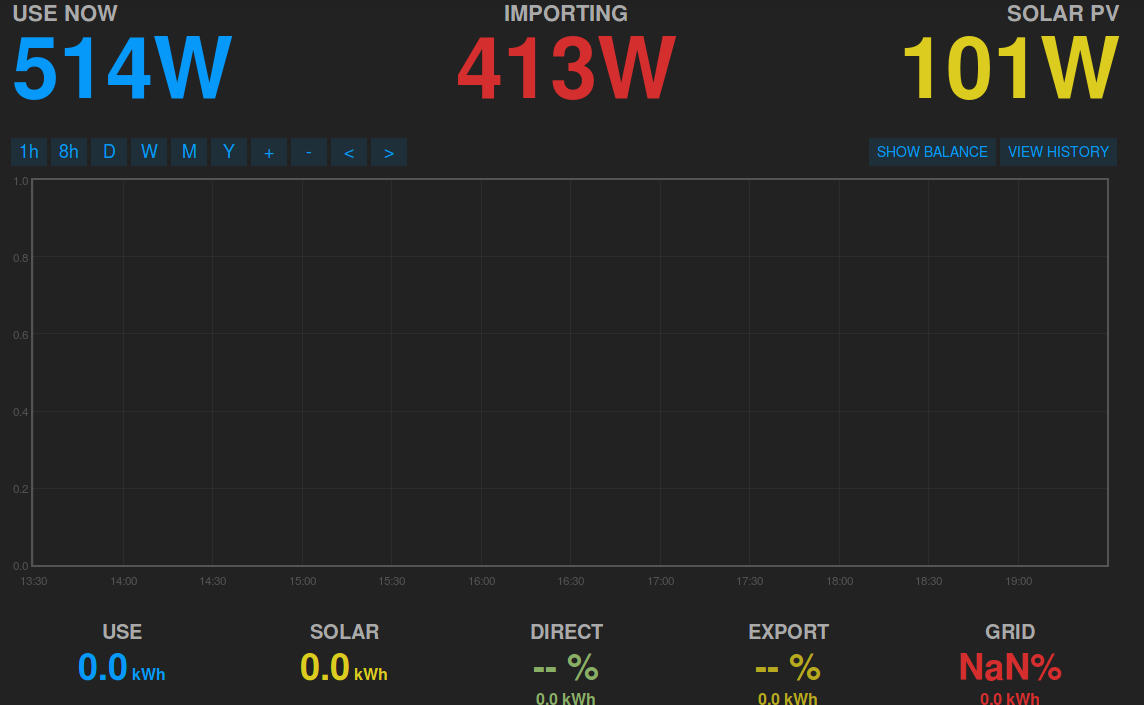
Hello, My local emoncms graphs on ‘My Solar’ have stopped showing the recent history, since 17th August. The graph starts again whenever I log in. The ‘Use now’, Importing’ and ‘Solar PV’ values show above where the graph should be and are updating fine every few seconds as normal. Also, the Emoncms.org remote logging works fine!
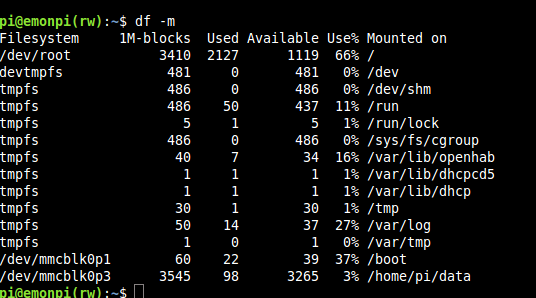
I’ve checked the spare disk capacity in /home/pi/data and there’s loads of space. Ditto /dev/root.
I’ve taken a couple of screenshots in case they’d be useful but can’t see how to upload them.
Am I doing something wrong? I have not updated anything as far as I know, nor have there been power cuts (anyway I have a ups). Thanks for any help - this is a great forum.
Drag and drop into the editing box - where you type, or use the “uparrow” icon that appears along the top edge of the editing box. (Hover your mouse and it says “Upload”)
As an alternative, if on Windows, use the snipping tool to take the screenshot, copy the image (into the clipboard) and simply paste (ctl-v) in the message editing box. This avoids saving images to disk. HTH.
Hi, I am having the same problem. I have been using a emonTX and Pi Model B/emonBASE for ages, and also have a PI3 for testing. I have just upgraded emoncms to the latest low-write 10.1.5 in preparation to test upgrading to the latest emonSD image and also to log locally instead of relying on emoncms.org.
I followed the guide for setting up Solar PV app for a Type 2, but I also get nothing on the History view.
2 caveats: My CT1 and CT2 are the opposite way around from the guide, with CT1 being solar and CT2 being Grid, and my Grid CT Clamp is the “wrong” way around, so I use a “multiply by -1” as the first process to overcome this (it’s been like this for 4 years and not caused an issue for my original Pi Model B).
This might be an issue with being logged in or not - there have been some changes around this recently. @emrys or @TrystanLea would be the best people to have a look I suggest.
@trnjones do you see your apikey in the URL for the mysolar app? When I test here the requests made behind the scenes all appear to be working fine when I logout and the dashboard updates with new data including the graph, I will keep digging to see if I can work it out.
No, the URL for local logging is just http://192.168.1.9/emoncms/app/view. Thank you! Where in the file system is the file which stores the local data? I wonder if that’s stopped retaining stuff?
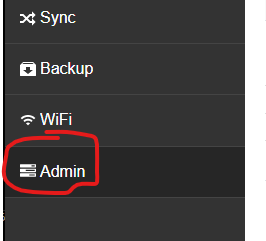
Try clicking on the admin link, if it asks you to log in again do so then look at the data again. I am pretty sure that it is because the website logs you out and stops updating the charts.
You can view the raw data to see if it continued to be collected.
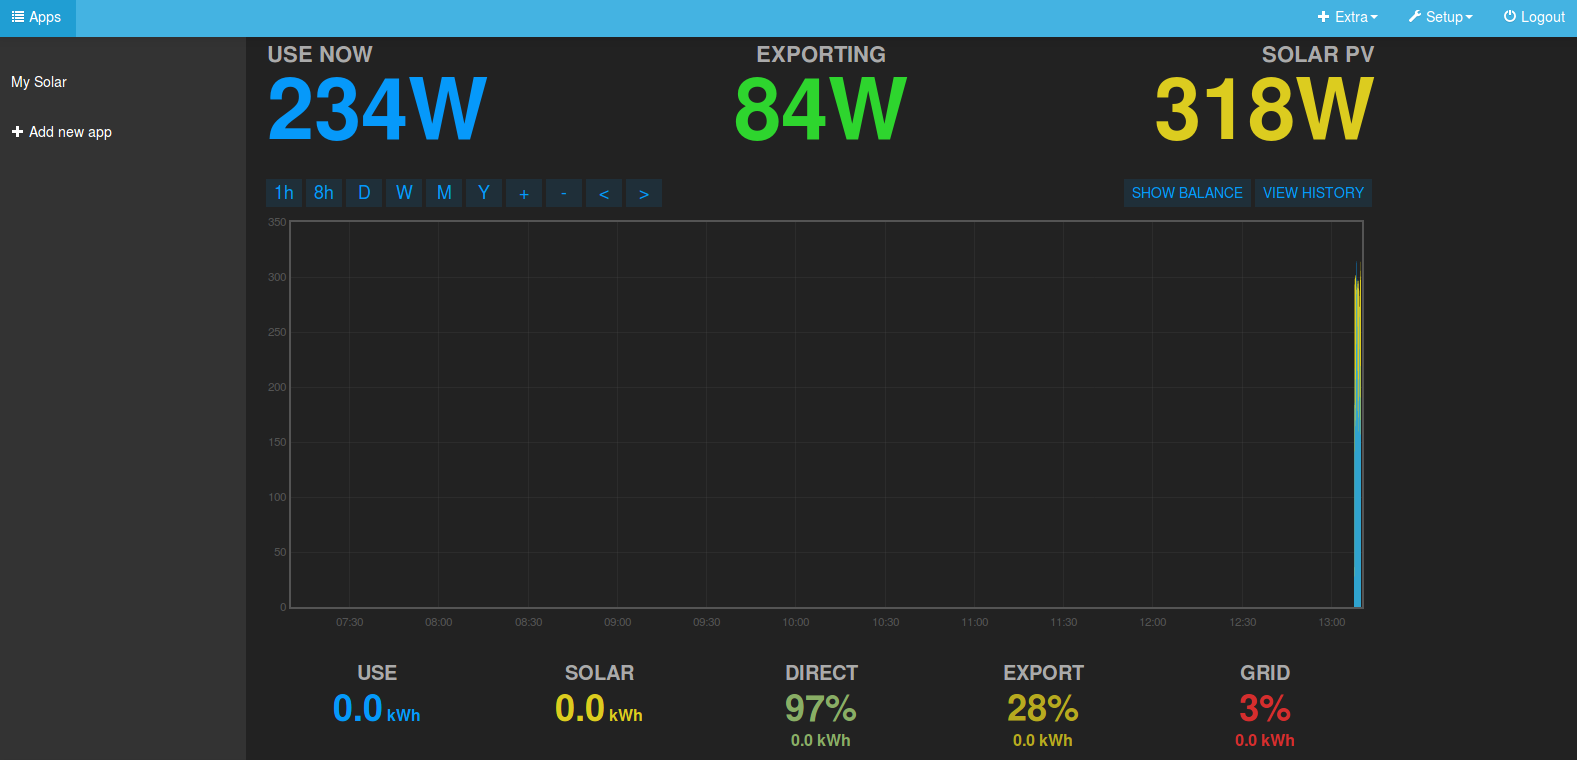
I am logged in and remembered on my computer. There is a ‘logout’ button above the graph on the right. I logged out and in again, but no change. The raw data is being collected fine, and shows on the attached screenshot - you can see where I have just logged in again it has started to show the graph. But when I close the window and reopen it, there is no graph again. It starts from when I go on the site. Maybe it is logging me out. How do I stop that?