Just a quick update - I did have a system crash this week, first time in the ~3 years it’s been running. Maybe a coincidence with the updates…. Anyway - what information should I try and capture if it happens again to help with diagnostics?
Hello @RichardinCancale What were the symptoms of the system crash? unresponsive ui? any ui errors? if it happens again, try rebooting your router first just in case it’s connectivity related..
Hi there - the UI was still responsive but all the inputs and feeds were static. When I checked back after rebooting I could see an ~11 hour window when nothing was logged in the database.
Just happened again… UI still functioning, all inputs are stuck, red bars beside all of them. Nothing special to see in the system information… I do get a “Script Error (see browser console log for details)” message after each interaction. Anywhere to look for more info?
System Information
System Information
Emoncms
- Version: low-write 11.18.0
- Git URL: GitHub - emoncms/emoncms: Web-app for processing, logging and visualising energy, temperature and other environmental data · GitHub
- Git Branch: stable
- Git Describe: 11.18.0
- Components: Emoncms Core v11.18.0 | App v3.4.4 | EmonHub Config v2.1.6 | Dashboard v3.1.1 | Device v2.5.0 | Graph v3.3.0 | Network Setup v1.1.0 | Backup v2.5.0 | Network v3.3.0 | Postprocess v2.7.1 | Sync v3.5.0 | Usefulscripts v2.3.15 | EmonScripts v1.9.8 | RFM2Pi v1.4.4 | Avrdude-rpi v1.0.3 | EmonPiLCD v2.1.3 | Emonhub v2.8.1
Server
- CPU: Cortex-A72 | 1 Threads(s) | - Sockets(s) | 108.00MIPS |
- OS: Linux 6.1.0-rpi8-rpi-v8
- Host: emonpi | emonpi | (192.168.1.173)
- Date: 2026-09-25 10:38:20 BST
- Uptime: 10:38:20 up 3 days, 13:28, 0 user, load average: 0.00, 0.04, 0.05
Memory
- RAM: Used: 32.89% | Total: 908.4 MB | Used: 298.79 MB | Free: 609.62 MB
- Swap: Used: 0.00% | Total: 100 MB | Used: 0 B | Free: 100 MB
Disk
- /: Used: 67.96% | Total: 4.39 GB | Used: 2.98 GB | Free: 1.19 GB | Read Load: 1.21 B/s | Write Load: 3.89 B/s | Load Time: 924 days 1 hours 19 mins
- /boot/firmware: Used: 18.51% | Total: 509.99 MB | Used: 94.42 MB | Free: 415.57 MB | Read Load: n/a | Write Load: n/a | Load Time: n/a
- /var/opt/emoncms: Used: 8.68% | Total: 9.68 GB | Used: 859.76 MB | Free: 8.35 GB | Read Load: 0 B/s | Write Load: 0.65 B/s | Load Time: 924 days 1 hours 19 mins
- /var/log: Used: 11.98% | Total: 50 MB | Used: 5.99 MB | Free: 44.01 MB | Read Load: n/a | Write Load: n/a | Load Time: n/a
HTTP
- Server: Apache/2.4.57 (Raspbian) HTTP/1.1 CGI/1.1 80
MySQL
- Version: 10.11.3-MariaDB-1+rpi1
- Host: 127.0.0.1 (127.0.0.1)
- Date: 2026-09-25 10:38:20 (UTC 01:00)
- Stats: Uptime: 307731 Threads: 5 Questions: 6995 Slow queries: 0 Opens: 51 Open tables: 44 Queries per second avg: 0.022
PHP
- Version: 8.1.34 (Zend Version 4.1.34)
- Run user: User: www-data Group: www-data video Script Owner: pi
- Modules: apache2handler , calendar , Core , ctype , curl , date , dom v20031129, exif , FFI , fileinfo , filter , ftp , gd , gettext , hash , iconv , json , libxml , mbstring , mosquitto v0.4.0, mysqli , mysqlnd vmysqlnd 8.1.34, openssl , pcre , PDO , pdo_mysql , Phar , posix , readline , redis v6.0.3-dev, Reflection , session , shmop , SimpleXML , sockets , sodium , SPL , standard , sysvmsg , sysvsem , sysvshm , tokenizer , xml , xmlreader , xmlwriter , xsl , Zend OPcache , zlib
Redis
- Redis Server: 7.0.11
- PHP Redis: 6.0.3-dev
- Host: localhost:6379
- Uptime: 3 days
MQTT Server
- Version: Mosquitto 2.0.11
- Host: localhost:1883 (127.0.0.1)
Pi
- Model: Raspberry Pi 4 Model B Rev 1.5 - 1GB (Sony UK)
- Serial num.: 1000000058E43E92
- GPU Temperature: 48.7°C
- File-system: read-write
- emonpiRelease: emonSD-01Feb24
Is emonhub running, should show up at the top of the admin info page and then try emonhub from setup menu and take a look at the log , copy here if possible
Hi Trystan
This is all that’s in the log:
LAST ENTRIES ON THE LOG FILE
2026-09-21 20:09:35.940|WARN|emoncms_mqtt.php|Starting MQTT Input script
2026-09-21 20:09:35.993|WARN|emoncms_mqtt.php|Not connected, retrying connection
2026-09-21 20:09:36.004|WARN|emoncms_mqtt.php|Connecting to MQTT server: Connection Accepted.: code: 0
2026-09-22 18:45:43.216|WARN|index.php|406 Not Acceptable|dashboard/view
2026-09-22 18:45:52.315|ERROR|index.php|Not Authenticated|feed/list
2026-09-24 20:23:04.317|ERROR|index.php|Not Authenticated|feed/list
2026-09-25 09:50:58.282|WARN|feed_model.php|Feed model: Requested feed does not exist feedid=14
2026-09-25 09:50:58.289|WARN|feed_model.php|Feed model: Requested feed does not exist feedid=14
2026-09-25 09:50:58.293|WARN|feed_model.php|Feed model: Requested feed does not exist feedid=14
2026-09-25 09:50:58.288|WARN|feed_model.php|Feed model: Requested feed does not exist feedid=14
2026-09-25 10:23:06.379|WARN|emoncms_mqtt.php|Starting MQTT Input script
2026-09-25 10:23:06.423|WARN|emoncms_mqtt.php|Not connected, retrying connection
2026-09-25 10:23:06.433|WARN|emoncms_mqtt.php|Connecting to MQTT server: Connection Accepted.: code: 0
2026-09-25 10:57:58.137|ERROR|index.php|Not Authenticated|feed/list
2026-09-25 11:57:10.379|ERROR|index.php|Not Authenticated|admin/log
Sorry but I rebooted this afternoon - if/when it bugs again I will capture this log.
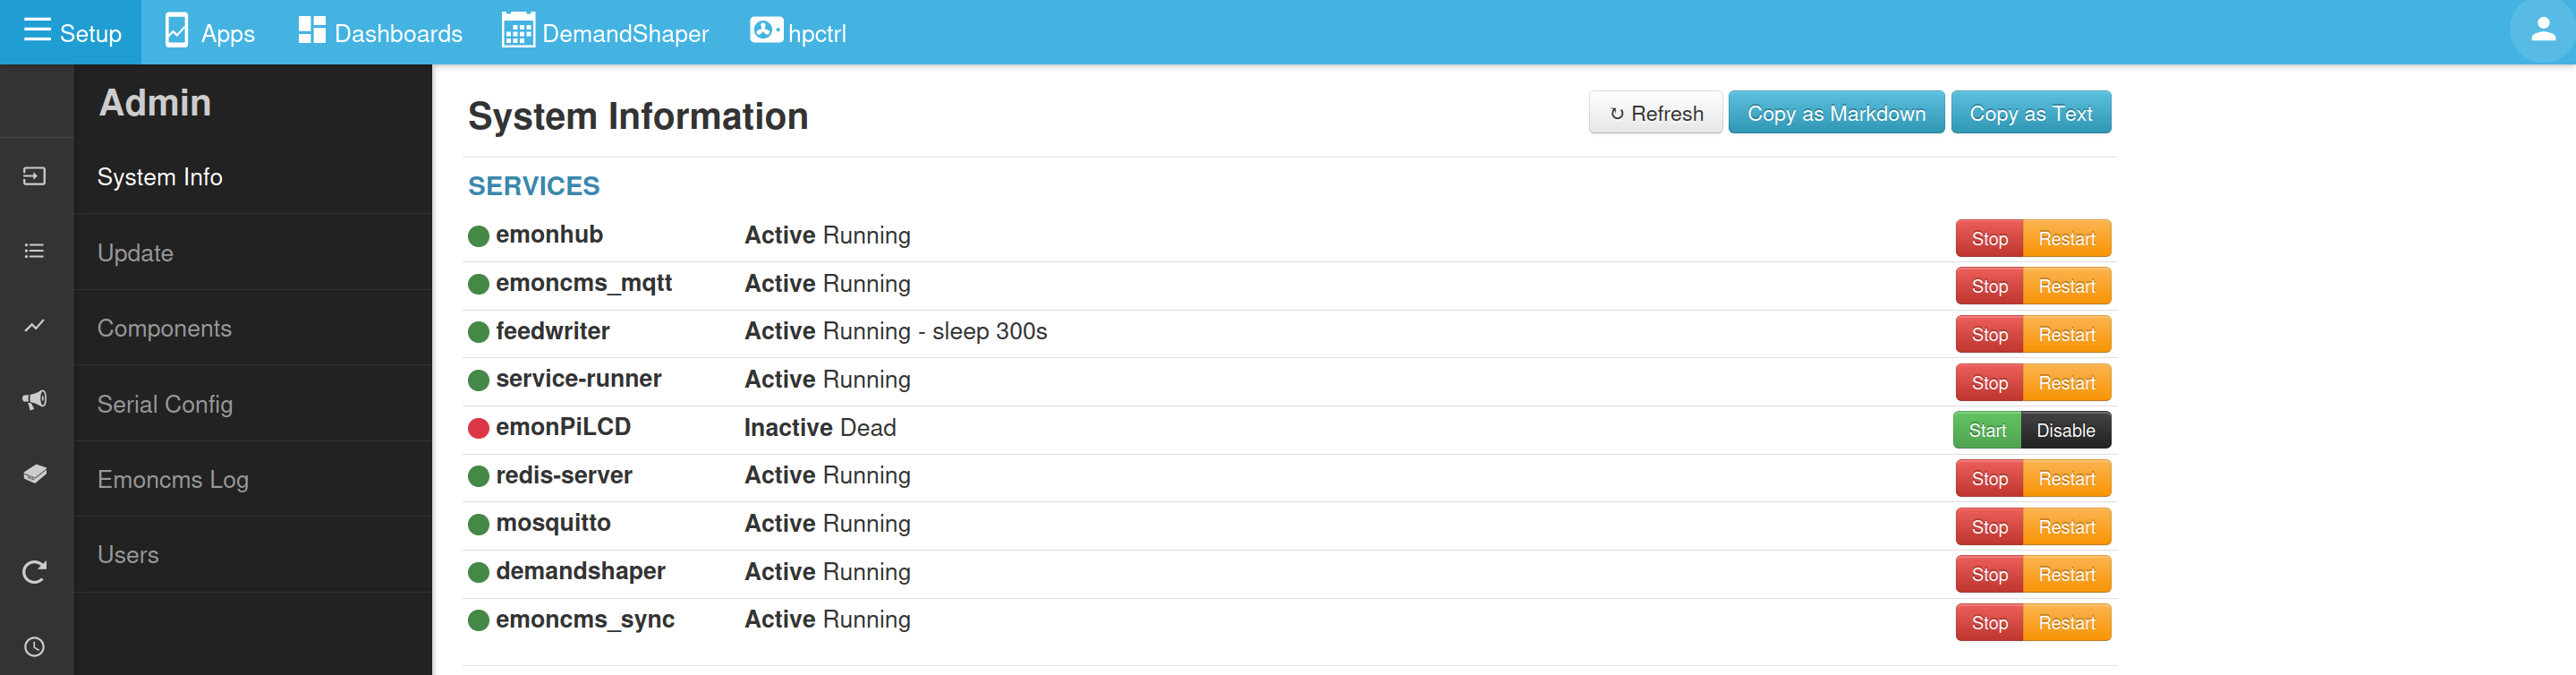
For the list of tasks I see them all running (ie red Stop button is available) except the LCD task is running and the Demand Shaper is “not found or not installed”
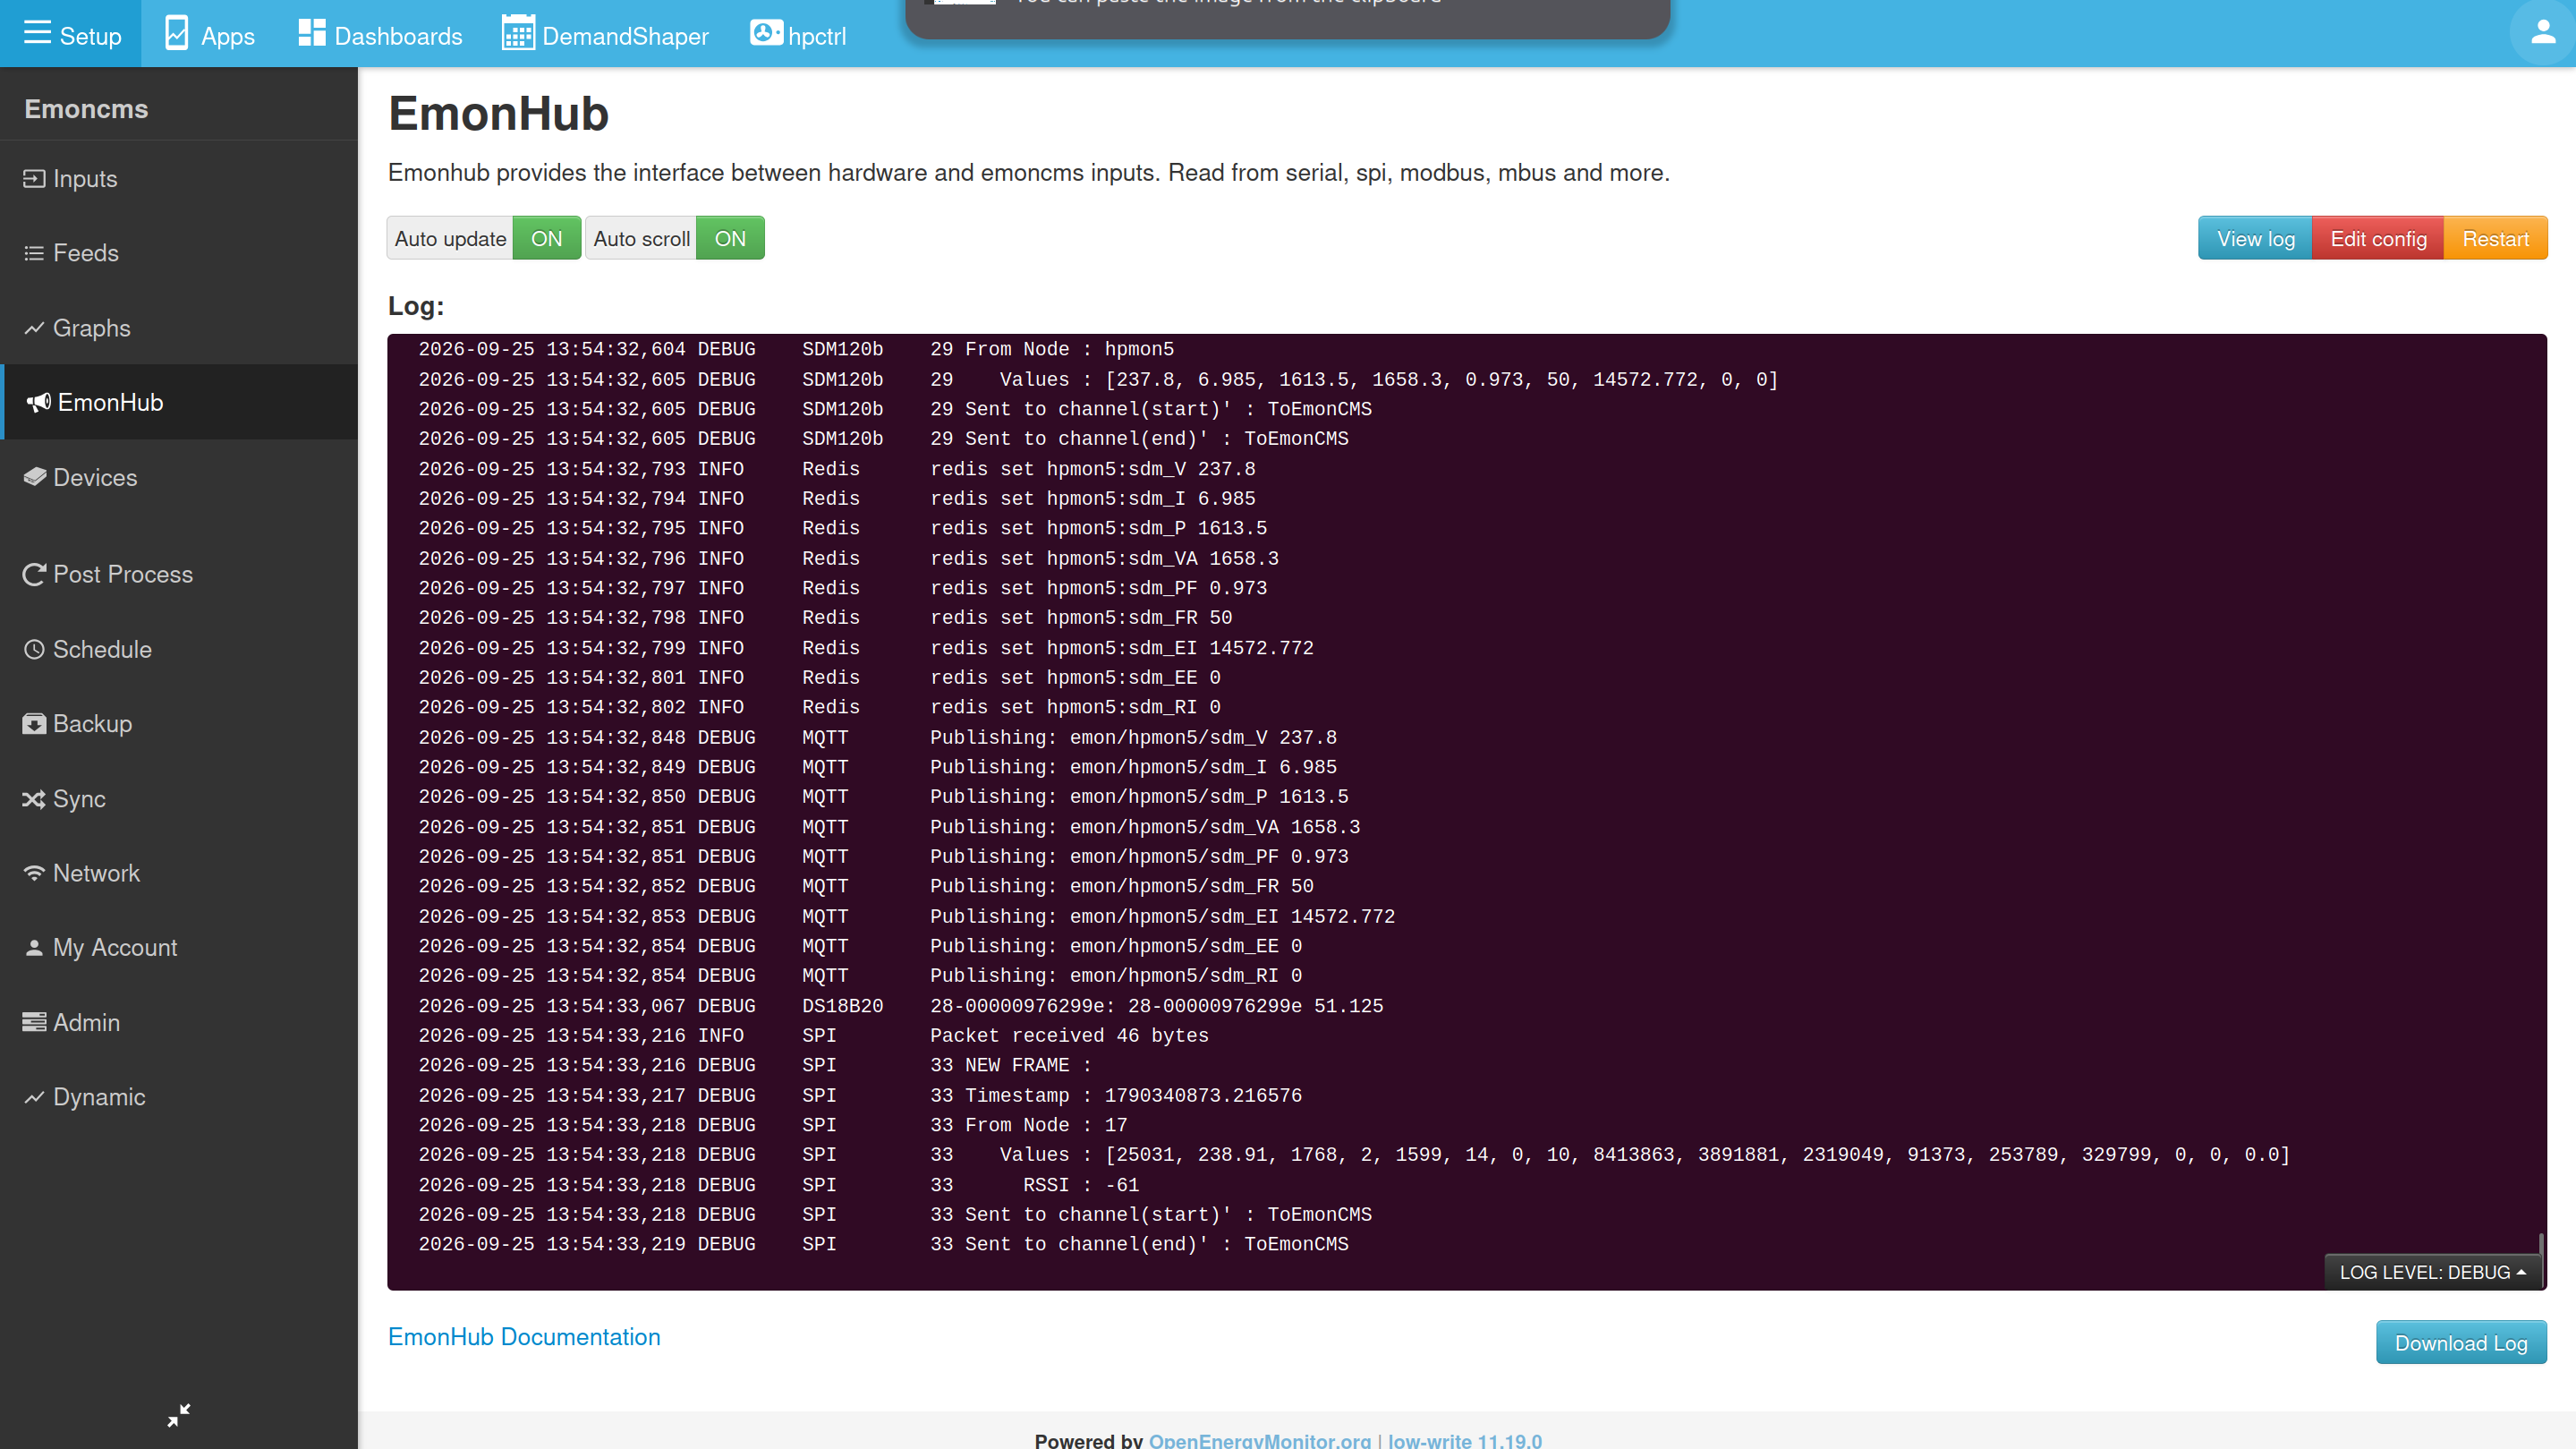
Hi Trystan, the monitor stopped around 9 hours ago accordyto the last update in the Feeds list. The Emonhub log is completely blank. I will leave it in this state in case you have any other things you want to see. Longer term I’ll need another s/w load I guess as bugging out every few days isn’t too helpful.
Hello @RichardinCancale can you restart emonhub on the Admin > Info page. Is the emonhub log still blank after the restart of emonhub? Does the restart of emonhub bring things back to life?
Hi - I haven’t restarted yet - waiting to see if there’s anything else I should look at before rebooting? Last time I rebooted (4 days ago) it came back to life OK, until early hours of today. Or do you mean is this log active when I reboot.
did you just restart emonhub last time or do a full reboot of the pi? if you did a full reboot last time, try just an emonhub service restart this time, it’s on the system > info page. When you restart emonhub the log should appear - there has been a long standing somewhat inconvenient bug with the emonhub log not always showing, i need to dig into why that is, a restart of emonhub usually brings the log back to life even though emonhub is usually working fine.
Hi - Yes the logging seems to stop after a few hours - I can restart it if I notice by doing a restart on Emonhub, as you noted, but maybe that will mask the cause of the actual bug that is causing the feeds to stop working…. Going to be hard to debug this one!
Il try and figure out first what’s causing that logging issue so that we keep the log working throughout and then from there hopefully that will give us some clues as to the actual issue.
Have you checked the card isn’t full?
SD Card failing?
In system info the disk / is marked as being 68% utilized. Other partitions are in the single digit usage. I presume if there were disk (SSD) errors they would be logged - which is why I’m trying to keep the logging going - or to see any comms errors etc…. Is there anywhere else I would see SSD errors?