sxw
1 June 2021 17:17
1
Hi,
I updated to emoncms 10.4 today, and it looks like stacked bar charts may have broken. Previously, stacked items appeared one above the other, as the name would suggest. Now the “Stack” option appears to do nothing.
Anything I should be looking at to try and track this down?
sxw
1 June 2021 20:32
2
I did a quick git bisect, and it says that this problem is introduced by:
commit 1b2561cdbba00ac953d15792b9f2ad0cf47c74c8
Author: chaveiro <[email protected] >
Date: Sun Feb 28 04:24:43 2021 +0000
Fix touch
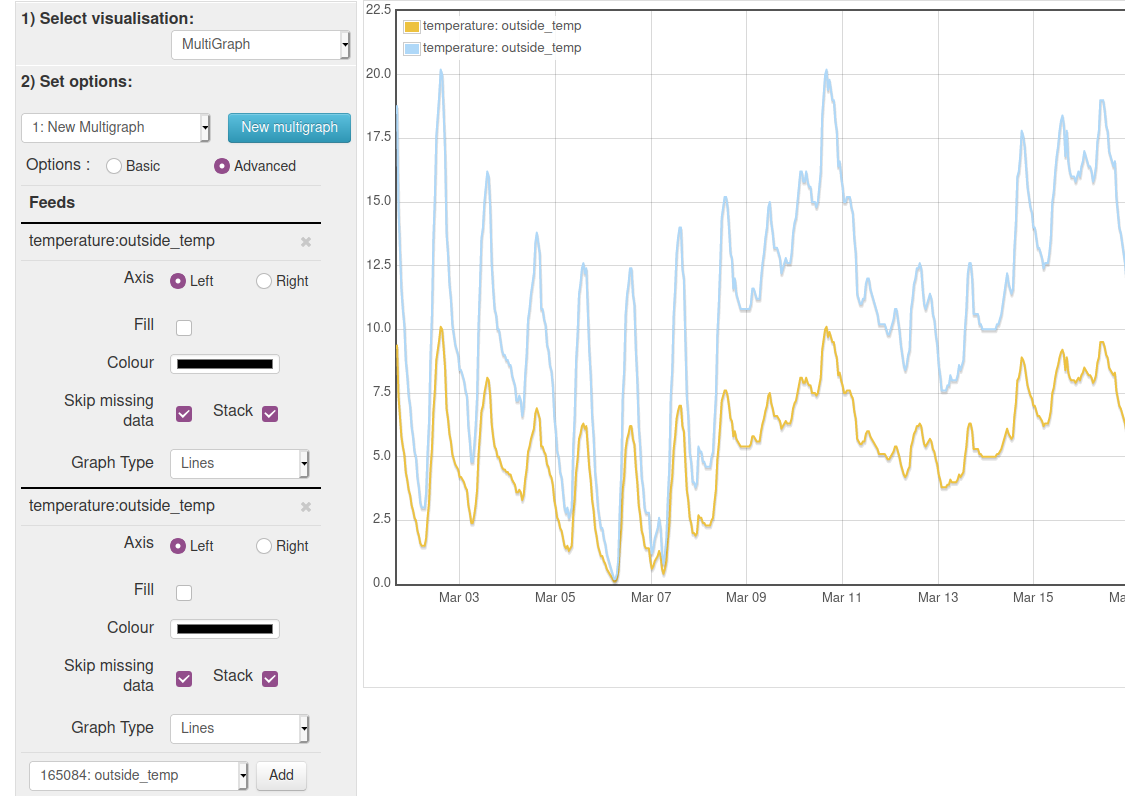
Hello @sxw are you using the multigraph in visualisations? Did you tick stack for both plots? It seems to work for me and the specific stacked graph visualisation as well.
sxw
1 June 2021 20:58
4
Hi,
Still using stable - here’s my graph setup …
I took a more detailed look at that commit, and if I apply this revert, stacking works again (essentially removing the ‘merged’ library and reinstating the individual library includes)
diff --git a/view.php b/view.php
index f9cc131..e728fc4 100644
--- a/view.php
+++ b/view.php
@@ -37,16 +37,13 @@
</style>
<link href="<?php echo $path; ?>Lib/bootstrap-datetimepicker-0.0.11/css/bootstrap-datetimepicker.min.css" rel="stylesheet">
<link href="<?php echo $path; ?>Modules/graph/graph.css?v=<?php echo $v; ?>" rel="stylesheet">
-
-<script src="<?php echo $path;?>Lib/flot/jquery.flot.merged.js"></script>
-<!-- <script src="<?php echo $path;?>Lib/flot/jquery.flot.min.js"></script>
+<script src="<?php echo $path;?>Lib/flot/jquery.flot.min.js"></script>
<script src="<?php echo $path;?>Lib/flot/jquery.flot.time.min.js"></script>
<script src="<?php echo $path;?>Lib/flot/jquery.flot.selection.min.js"></script>
<script src="<?php echo $path;?>Lib/flot/jquery.flot.touch.min.js"></script>
<script src="<?php echo $path;?>Lib/flot/jquery.flot.togglelegend.min.js"></script>
<script src="<?php echo $path;?>Lib/flot/jquery.flot.resize.min.js"></script>
<script src="<?php echo $path; ?>Lib/flot/jquery.flot.stack.min.js"></script>
--->
<script src="<?php echo $path;?>Modules/graph/vis.helper.js?v=<?php echo $v; ?>"></script>
<script src="<?php echo $path;?>Lib/misc/clipboard.js?v=<?php echo $v; ?>"></script>
<script src="<?php echo $path; ?>Lib/bootstrap-datetimepicker-0.0.11/js/bootstrap-datetimepicker.min.js"></script>
I really should get all this stuff somewhere where I can more easily push to GitHub!
Cheers,
Simon
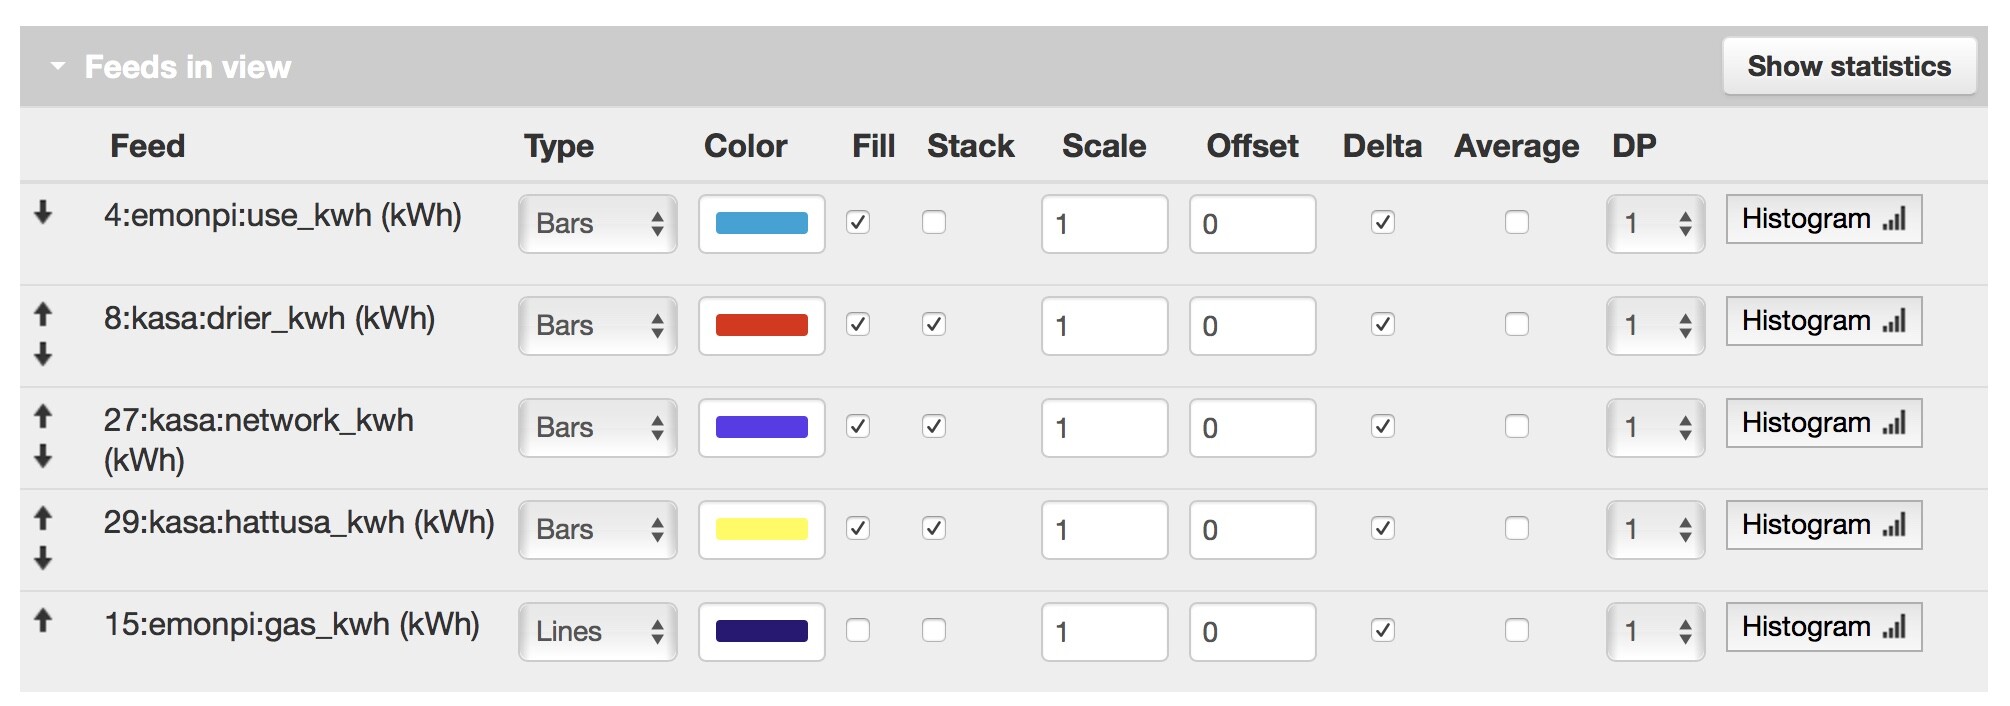
Hi there,
After this upgrade I lost the ability to stack lines in the graphs view.
Any ideas would be appreciated.
JEMONCMS
13 November 2021 12:53
6
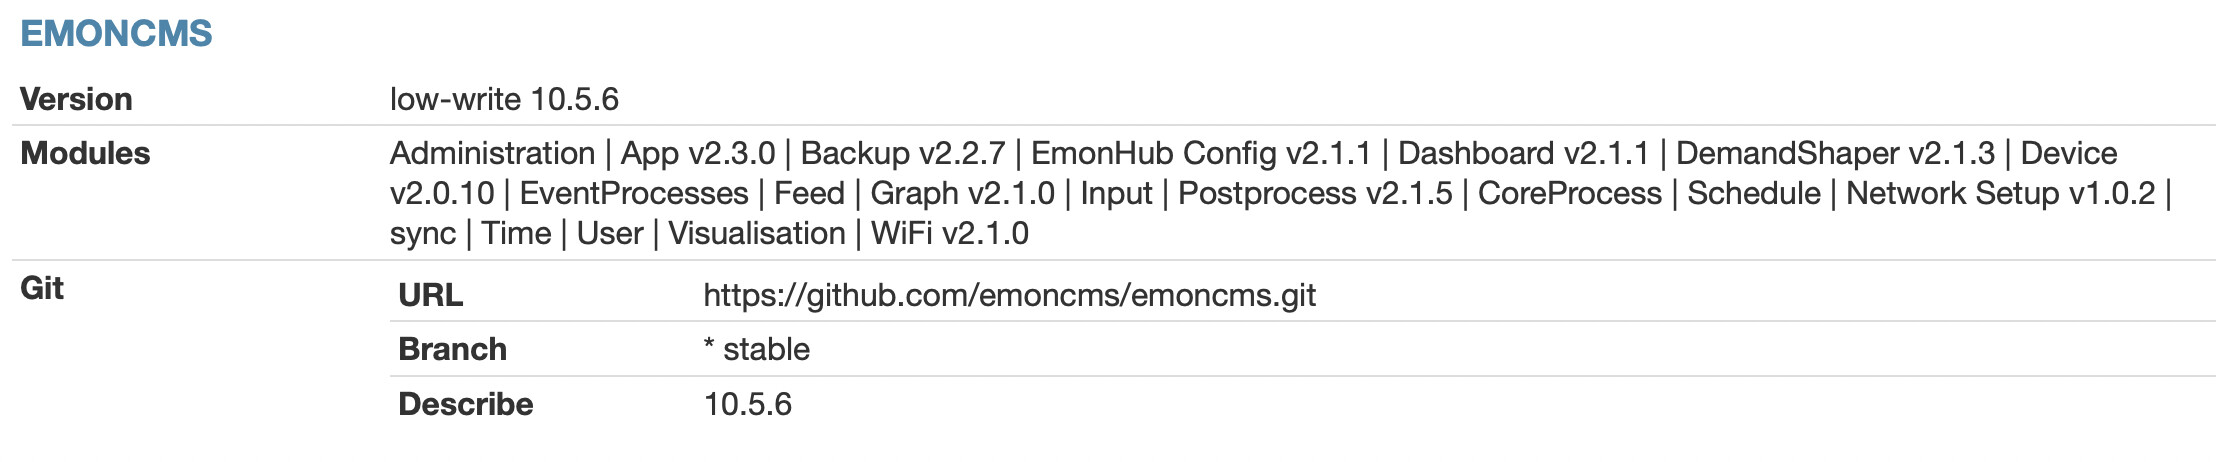
Hello! I have just started using emoncns and have noticed the stacked graphs feature does not seem to work in 10.8.5
Happy to help with testing.
J
Version
low-write 10.8.5
Git
URL
Web-app for processing, logging and visualising energy, temperature and other environmental data
Branch
Describe
10.8.5
Components
Emoncms Core v10.8.5 | App v2.3.4 | EmonHub Config v2.1.1 | Dashboard v2.1.5 | Device v2.1.3 | Graph v2.1.1 | Network Setup v1.0.2 | WiFi v2.1.0 | Backup v2.3.2 | DemandShaper v2.2.2 | Postprocess v2.2.2 | Sync v2.1.1 | Usefulscripts v2.3.7 | EmonScripts v1.3.9 | RFM2Pi v1.4.1 | Avrdude-rpi v1.0.0 | Emonhub v2.3.1 | EmonPi v2.9.4
m2ts
22 December 2021 06:10
7
@TrystanLea , it seems to working with Visualization > Multigraph, but not with Graphs. I’m on emoncms 10.5.6. Also the topic Graphs are no longer stacking mentions this problem.
llpamies
17 January 2022 06:59
8
With version 10.8.5 I can also confirm that stacking is broken.