I hope that was during a warm bit of daytime, else I am really puzzled by our COP of 3.97 during a steady period of 4kW yesterday evening, despite a couple of known problems I want fixed already.
It was +7C outside, and flow temp about 35, return about 30, averages. Mine seems to do what the data shows if I can manage to get it in steady state. That seems a challenge
To be clear, what conditions were you 3.97 measured in? What was it measured with and is it allowing for glycol. There are two issues I am grappling with. 1) In steady-state, is the COP as data sheet . 2) What actual final COP when in normal use and stopping and starting etc.
Ambient +7°C, flow temp average 37, return temp average 32.5, read from melcloud and I hope it allows for glycol. The data sheet for my 8.5kW model makes me think COP should be over 4.4 in that situation, as that’s what’s given for a 40° flow at 6.8kW. The 35° flow 7° ambient curve in the graphs shows a COP above 5 for 4kW. The 45° flow one shows just below 3.8 for 4kW. So would you agree that mine is underperforming at present?
I agree that getting it into steady-state seems to be the challenge. The current firmware seems far too keen to aggressively increase flow temperature and trigger a flow ≤ return+3 shutdown.
@mjr You might be interested in this file:
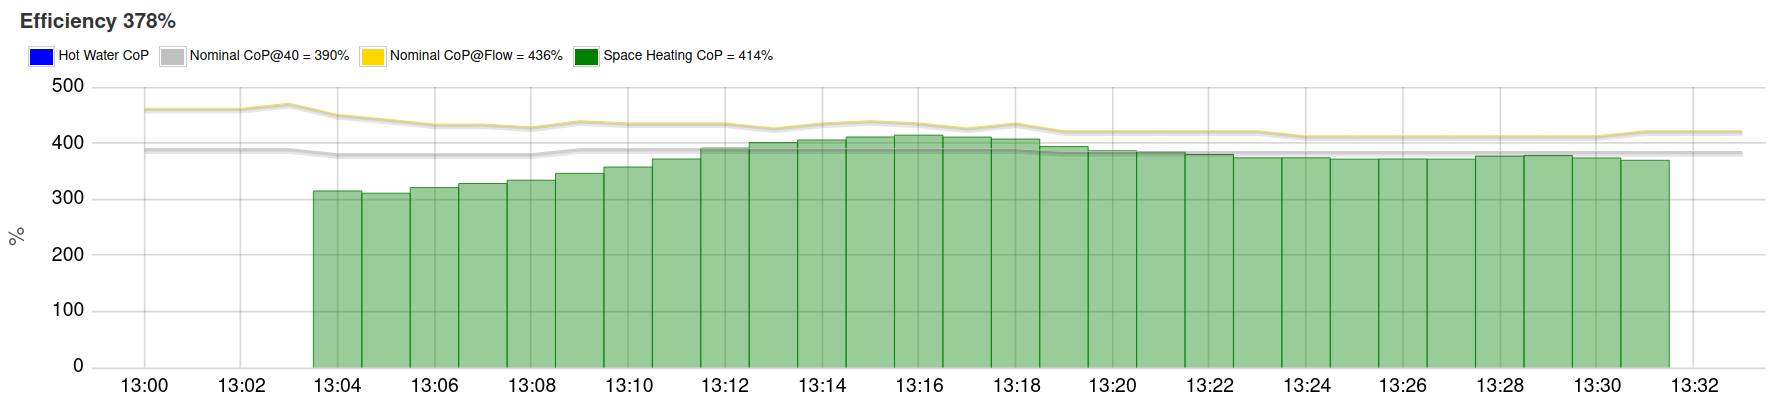
It’s used on this line of my app:
so that it charts the efficiency for actual flow and ambient temperature.
As a result you can see the gold line on this chart shows I’m not hitting the “Nominal CoP@Flow” so my system isn’t performing terribly well.
As you can guess, I got bored of interpolating the figures mentally and looking at the other charts, I wanted the computer to do it for me.
ofc that set of efficiencies is for my heat pump, you’d need to enter the ones for yours. That will also get boring because you’d need to enter every flow / ambient combination which in my case is 35 x 30 which is about 1,000 entries.
So what I actually did was enter the ones from the data sheet and let the computer do the work. I love discourse, but it’s not going to let me upload those files, so here goes!
This is device_efficiencies.json :
{
    "25": {
        "nominal": {
            "-10": 2.59,
            "-7": 2.78,
            "2": 2.99,
            "7": 4.54,
            "12": 5.18,
            "15": 5.35,
            "20": 5.57
        }
    },
    "35": {
        "nominal": {
            "-20": 1.51,
            "-15": 1.96,
            "-10": 2.41,
            "-7": 2.68,
            "2": 3.11,
            "7": 4.26,
            "12": 4.51,
            "15": 4.66,
            "20": 4.91
        }
    },
    "40": {
        "nominal": {
            "-20": 1.37,
            "-15": 1.78,
            "-10": 2.19,
            "-7": 2.44,
            "2": 2.86,
            "7": 3.81,
            "12": 4.03,
            "15": 4.17,
            "20": 4.4
        },
        "mid": {
            "-20": 2.13,
            "-15": 2.23,
            "-10": 2.33,
            "-7": 2.39,
            "2": 3.01,
            "7": 3.75,
            "12": 4.11,
            "15": 4.33,
            "20": 4.7
        },
        "min": {
            "-20": 2.13,
            "-15": 2.23,
            "-10": 2.33,
            "-7": 2.02,
            "2": 2.46,
            "7": 3.41,
            "12": 3.89,
            "15": 4.17,
            "20": 4.65
        }
    },
    "45": {
        "nominal": {
            "-20": 1.23,
            "-15": 1.6,
            "-10": 1.97,
            "-7": 2.19,
            "2": 2.61,
            "7": 3.35,
            "12": 3.56,
            "15": 3.68,
            "20": 3.89
        }
    },
    "50": {
        "nominal": {
            "-15": 1.58,
            "-10": 1.84,
            "-7": 2,
            "2": 2.38,
            "7": 3.03,
            "12": 3.21,
            "15": 3.32,
            "20": 3.51
        }
    },
    "55": {
        "nominal": {
            "-15": 1.55,
            "-10": 1.71,
            "-7": 1.8,
            "2": 2.14,
            "7": 2.7,
            "12": 2.87,
            "15": 2.96,
            "20": 3.13
        }
    },
    "60": {
        "nominal": {
            "2": 2.05,
            "7": 2.46,
            "12": 2.57,
            "15": 2.63,
            "20": 2.74
        }
    }
}
and this is the script to do the interpolation:
import json
import pprint

with open("device_efficiencies.json") as de:
    allEfficiencies = json.load(de)

    outcome = {}
    for flowTemp in allEfficiencies.keys():
        flowEfficiencies = allEfficiencies[flowTemp]
        interpolatedEfficienciesForTemp = outcome.setdefault(flowTemp, {})
        for series in flowEfficiencies.keys():
            interpolatedEfficienciesForSeries = interpolatedEfficienciesForTemp.setdefault(series, {})
            efficiencies = flowEfficiencies[series]
            temperatures = [int(t) for t in efficiencies.keys()]
            for i in range(0, len(efficiencies) - 1):
                currentTemp = temperatures[i]
                nextFlowTemp = temperatures[i + 1]
                domain = range(currentTemp, nextFlowTemp)

                currentEfficiency = efficiencies[str(currentTemp)]
                nextEfficiency = efficiencies[str(nextFlowTemp)]

                for temperature in domain:
                    efficiency = currentEfficiency + (temperature - currentTemp) * (nextEfficiency - currentEfficiency) / (nextFlowTemp - currentTemp)

                    interpolatedEfficienciesForSeries[temperature] = round(efficiency, 2)
            lastTemp = str(temperatures[-1])
            interpolatedEfficienciesForSeries[int(lastTemp)] = efficiencies[lastTemp]

    # Now interpolate across flows

    flowTemps = [str(t) for t in sorted([int(t) for t in outcome.keys()])]
    for i in range(0, len(flowTemps) - 1):
        localFlowTemp = flowTemps[i]
        nextFlowTemp = flowTemps[i + 1]
        localEfficiencies = outcome[localFlowTemp]
        nextEfficiencies = outcome[nextFlowTemp]

        for series in localEfficiencies.keys():
            if series in nextEfficiencies.keys():
                print("Interpolating between " + localFlowTemp + " and " + nextFlowTemp + " for " + series)

                localSeriesEfficiencies = localEfficiencies[series]
                nextSeriesEfficiencies = nextEfficiencies[series]
                for intFlowTemp in range(int(localFlowTemp) + 1, int(nextFlowTemp)):
                    proportion = (intFlowTemp - int(localFlowTemp)) / (int(nextFlowTemp) - int(localFlowTemp))
                    intFlowTempBucket = outcome.setdefault(str(intFlowTemp), {})
                    seriesBucket = intFlowTempBucket.setdefault(series, {})
                    for outdoorTemp in localSeriesEfficiencies:
                        if outdoorTemp in nextSeriesEfficiencies:
                            efficiencyRange = nextSeriesEfficiencies[outdoorTemp] - localSeriesEfficiencies[outdoorTemp]
                            seriesBucket[outdoorTemp] = round(localSeriesEfficiencies[outdoorTemp] + proportion * efficiencyRange, 2,)

    pprint.pprint(outcome)
    with open("interpolated_efficiencies.json", "w") as ie:
        json.dump(outcome, ie, indent=4, sort_keys=True)
It looks plausible, but you might have to tweak it if there’s a bug I didn’t spot.
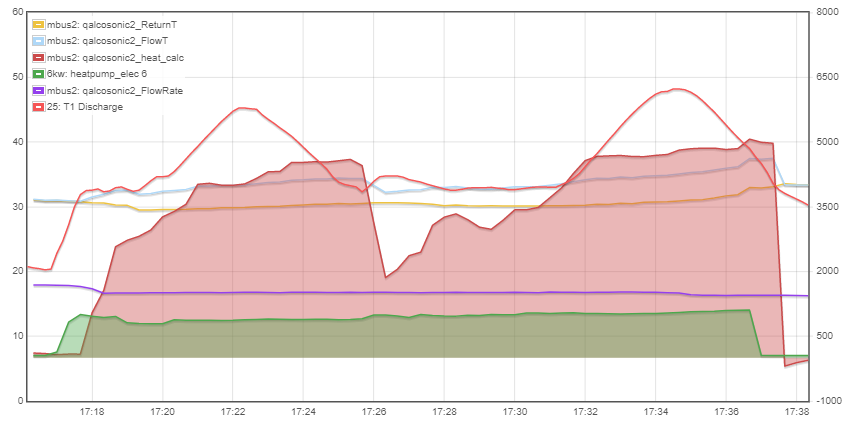
I dont think the Mitsi COP estimate is very accurate. Mine shows a lower COP than my measurements with proper heat meter. The Mitsi system uses a vortex-flow sensor and might be using the strap-on sensors… not certain. Anyhow, my new and old units do what it says on the tin, BUT my new one does these strange dips in output when on low load (as graph). here the average heat output is around 3kW… It should do that in steady state. COP here (in ideal conditions, 7 degrees out) is 3.94, but the tail end 17:32 to 17:37 is COP 4.5. I think it should do steady state with better COP than it is. I don’t know if you are getting these drop-in-output issue too, or if your COP estimate is low
I’ve only got the 5-minutely readings. I’ve not done whatever is needed to get the minute-by-minute readings back (phone Mitsubishi? Do some network funnies to intercept the melcloud internet traffic but it’s probably/hopefully done over TLS to avoid people outside my house doing that. Or get an mbus splitter and figure out where to connect it and what to…). So I can’t be sure that I’m seeing the abrupt output drops, but it looks very possible.
How’s that going? I tried a naïve contact through the melcloud app and got nothing back. I’d really love to know what their heat-thermostat mode logic is, to consider whether that could be useful as a cycle-breaker, without waiting for warmer weather when it’s cheaper to let it run and observe it.
And of course, it would be useful to know what actually changed in November.
A big established company like Mitsubishi really should be better at customer communications than this. I’m feeling a bit like a mushroom…
Sorry, I’m absorbed in something else for a while and the heat pump is just in the background for a while.
Cross-post so folks know what’s happening:
Hi, can someone provide the update files for FTC5?