Don't apply the firmware update to your Ecodan FTC5 (yet)

Yesterday I was running:

“FirmwareAppVersion”: 17000,

and I took the update today and am now running:

“FirmwareAppVersion”: 19000,

This is the first time I was offered a firmware update.

I can still alter settings on my heatpump using the API, but the usage data is looking stale.

Hopefully I can prove this is a false alarm.

ofc this is a really good reason not to rely on external parties (in this case the WiFi module on the heat pump).

I’ve tried a lot of things and none of them are helping.

I’ve lost access to most of the useful data in the payload and when it does appear it stays stale for huge amounts of time.

Ironically it seems the device itself is responding to MELCloud commands faster than it was before.

At this point it looks as though they’ve stopped updating the superfluous parts of the datagram which they don’t need for their UI. However, those things were the interesting parts to my algorithms.

To give you and idea of how bad it gets if you update the firmware, I can no longer see the flow and return temps.

@TrystanLea be careful out there.

O no, that’s a pain!

Have you seen by any chance all the work out there by others reading from and controlling their mitsubushi equipment including the Ecodan via the CN105 connector that the Melcloud box uses? Im going to try this on my heat pump very soon, looks really promising!

Here are various github repositories and discussion threads on the topic:

GitHub - SwiCago/HeatPump: Arduino library to control Mitsubishi Heat Pumps via connector cn105

https://www.geekzone.co.nz/forums.asp?forumid=73&topicid=265469

Hacking a Mitsubishi Heat Pump / Air Conditioner - nicegear blog

Mitsubishi-CN105-Protocol-Decode/community - Gitter

GitHub - m000c400/Mitsubishi-CN105-Protocol-Decode: Documentaion of Mitsubishi CN105 Protocol of Ecodan Air Source Heat Pumps

GitHub - BartGijsbers/CN105Gateway: ESP32 based MQTT gateway for the CN105 protocol based Mitsubishi Heat Pumps (FTC5)

MiniSplitPi — The Mini-Split Raspberry Pi Web Controller

Thanks @TrystanLea , John Cantor pointed me to those too (because you pointed him to them :slight_smile: )

As I’m on the RHI thing I’m trying to do this without tinkering with the hardware at the moment.

I was also hoping that folks such as @muhrix would be able to do this via the web too.

I’ve looked around all the other open source interactions with MELCloud and they are all impacted in the same way. Most of them aren’t bothered because they don’t go after the minutiae that I’m chasing in the data structure.

I’ve contacted Mitsubishi and haven’t got anything back yet.

I’m trying to go via my installer now.

I have looked into the data from the “Reports” section of MELCloud. That is giving me per-minute flow and return which is lucky because that’s the backbone of my algorithm, but everything else is per-hour which is practically useless.

On the bright side, the heat pump is tootling along and keeping us warm, it’s just running far too much of the time and is clearly using more energy than it should. Yesterday it used 30kWh / £4.80 whereas a similar day like that early in the month used 20kWh / £3.00.

1 Like

Oh that’s annoying - but not the first time manufacturer changes affect an unsupported API (I had similar issues on at least two other, unrelated, platforms).

I haven’t got my ASHP yet (because Mitsubishi are struggling with supply), but I’m trying to do the prep work.

I was already concerned about having to go via Melcloud because that would rely on my internet connection (which is unreliable).

I came across this repo: https://github.com/ncaunt/meldec
I loved the level of reverse engineering the author went through, though not sure if the repo is actively maintained or if the code works (I can’t test anything yet).

A local serial communication would be preferable to me in the longer term, but the convenience of using the system out-of-the-box as @MyForest does, makes that my number 1 choice too.

If the per-minute data appears on the dashboard/live data/report with per-minute granularity, then there is hope.

1 Like

Thinking about it, surely the EMP3 (MMSP) kit is streaming per-minute data to Melcloud servers, so sniffing the stream (like in the meldec repo) may be one way to consume the data locally.

Question to @MyForest whilst you cannot get per-minute readings, does the writing still work? As in, are you still able to change target temp (for CH and DHW) and flow temp?

Yep, I’m still able to alter the settings, but the algorithm was using the per-minute data to decide which commands it wanted to send. Seeing things at hour-level granularity is pretty hopeless. In fact I was hoping to get faster updates, not slower!

Yep, I could hack the traffic like meldec, but I’m trying to keep it simple (and failing).

I had already cracked open Wireshark in desparation on Monday and then put it away again.

1 Like

I’ve contacted my installer and they are going to put me in touch with the Mitsubishi representative to see if we can get some progress.

Clearly I can do a bunch of things to help myself here, but I’m trying to get to a point where this is easy for other people too so I’d prefer Mitsubishi supported what we’re trying to do, especially in the spirit of the MMSP intention.

I’m in touch with the Mitsubishi representative now and they sound keen to understand my problem.

Unfortunately I had to phone a landline for the helpdesk and I got stuck in a queue and had to go to work so couldn’t hang on to talk to the technicians.

Hallelujah!

The per-minute energy consumption data is back.

I don’t know why.

Things are working beautifully again.

I’ll keep chatting to Mitsubishi and see if the new world we find ourselves in makes them more amenable to supporting these types of use cases.

If I were a cautious person I’d still hold off the firmware update if I were you. Maybe devices on the old firmware will stop working at some point? I don’t know at the moment.

2 Likes

As a gift of schadenfreude, here’s what a debacle looks like.

I updated my firmware around noon on the 22nd.

After a while I was able to patch in the flow and return temps at minute-granularity by getting them from another part of the website.

You can see my lovely ebb-and-flow pattern changed into some more grisly cycling on and off about 5 times an hour versus my typical 15 times per day. Admittedly the flow temp was too low, but that was all part of my algorithm being a bit daft and me having stupid amounts of work to get done elsewhere at the moment so not getting it fixed.

Even with the total chaos, the humans still didn’t make any comments about being uncomfortable and there was sufficient hot water.

I can’t tell exactly how the efficiency changed because I lost the power readings. From the MELCloud interface you can see the CoP went below 3 for the first time on Monday when I lost control.

It seems unfair to say that though because the weather also got colder this week.

However, even when it was colder on the 3-5th November the well-informed algorithm’s behaviour delivered a CoP above 3.

image

Maybe I should trip the algorithm up again by making it less well-informed but also carry on capturing the detailed energy usage. Oh to have more time to play.

Anyway, hopefully this will encourage people (including me) to double-down on resiliency and graceful degradation.

1 Like

Well, the adventure continues.

This is news…I honestly don’t know if this is good or bad.

We had a power cut around 08:20 and my daughter turned the power back on at 08:40.

It looks as though we’re back to missing the detailed data again. I honestly don’t know why. Of course I’m going to see what’s up with the WiFi interface. If it simply wasn’t working we’d get no data, so that’s not the problem.

I could make all sorts of wild speculations about the servers only choosing to expose the detailed data after 2 days of solid inputs or all sorts of things. I can’t provide any evidence to back up any wild theories so far so I’ll keep them to myself.

[Edit: Seeing those steps at exactly 09:00, 10:00, 11:00…suggests that the communication is working, but the data being returned from the server has gone back to hourly. Notably, I can see the per-minute changes on the MELCloud reports website, just not in the ListDevices endpoint]

[Edit2: So potentially the “use hourly granularity” is a consequence of “the interface stopped reporting” (which could be an upgrade or a power cut). We’ve had power cuts before and I haven’t seen this behaviour, but it might be independent of the firmware upgrade, it could just be some server behaviour they implemented at some time in the last few months]

1 Like

Thanks for the updates @MyForest interesting following along!

1 Like

Catching up with the latest messages…

I got excited with the good news, but I’m now puzzled by this behaviour.

@MyForest if you can see the data in Melcloud, your WiFi interface is working (sending the data).

For some reason, their servers are not responding to your API queries.

The power cut is an interesting data point. The fact that it started working again is also relevant.

I’m glad that you are in touch with Mitsubishi - I’d expect they should be able to share an explanation.

IIRC you are using your own implementation to fetch data. Have you tried the pymelcloud code to see if it makes a difference?

Until I have my own hardware, I don’t think I can be much help other than speculating.

1 Like

Yes, that’s true.

BTW the detailed data is missing from the packets that arrive on the client-side. The server-calculated report data is granular, but there isn’t a granular report on energy data so I can’t infer minute-level data from a report either.

They are responding. The power consumption stats only change once an hour instead of every minute.

I’ve now put a bot in place to flip me back to using the extra data once the bot has identified that it’s safe to use (i.e. varying every minute).

Thanks for the pointer, they are using less of the API than I am so they aren’t seeing the part of the API that I’m delving into.

Don’t worry about me, I know I’m working at the bleeding edge. I’m fine with it (mostly!)

Sigh.

Was just going through the whole “turn it off and on again” rigmarole to no avail.

Still not making any real progress.

However, it’s sorta fun watching it in “default” mode. Here you can see that when the flow temp was low it cycled quite a bit. When I bumped up the flow temp it stopped cycling but had to defrost about every hour.

Ooh, this just got interesting.

I’ve been using MELCloud’s “Energy Report” to give me a very high-level summary of the heat pump’s view of the energy consumption which I use as the summary on our house portal. I’ve never really looked at it because the detailed data from the devices is at one-minute granularity and that detailed data is what I send to EmonCMS.

It transpires that the energy report does actually update every minute. It also transpires, because of the way I do things, that I have all of the energy reports for every minute since the heat pump was fired up and linked to MELCloud. That’s 3,020,747 files.

So now I can work out the per-minute energy usage just by doing a delta between each report.

Of course it’s not that simple in real-life. The report data needs a bit of care. For example, I rather usefully remembered to ask for yesterday’s report so that I get the last few readings when the clock ticks over. The MELCloud stuff also doesn’t seem to handle daylight saving time in a way I expect (because all my systems expect everything to chatter in UTC to avoid the excitement).

The other big exciting thing is the power cuts or when monitoring goes down. In that case I might find the amount of energy consumed has changed, but not know which minutes it was actually used in because the report granularity is hourly. All I can reasonably do it allocate it out across the missing window. It’s not great, but I can’t allocate it to a single minute because it’ll be a ridiculous spike. Obviously it shouldn’t use power when there’s a power cut, but different systems come online at different rates and anything is possible.

I’m off to do some intrepid data munging.

BTW I have over 6 million files from various aspects of the heat pump. That takes up just over 40GB. As a result, I really don’t get at all bothered about the 1GB for my feed storage in EmonCMS! (of which only 145MB is the heat pump).

Just an FYI. MELCloud has a “CSV Report” which piqued my attention when I saw this in the JSON:

“CSVReport1min”: true,

However I don’t want to burden their servers asking for that. It takes over a minute to generate and it’s over 20MB. I can’t reasonably request that every minute.

I want up-to-date info so my algorithm can control the heat pump and it’s so trigger-happy it really does rely on the per-minute changes. In fact I’d like it to be even more active, especially around gently walking up the target flow temperature (because that’s the only control I have over the power consumption). Yes, I know I need to just hook some wires into it, but I can’t risk voiding the warranty.

The CSV report does contain about half a million rows of the per-minute data from the last year. It has these fields:

TimeStamp
RoomTemperatureZone1
RoomTemperatureZone2
OutsideTemperature
FlowTemperature
EnergyConsumed
EnergyProduced
OperatingMode

Where OperatingMode is from [“Stop”, “Heating”,“HotWater”,“FreezeStat”].

It looks fairly sensible, but ofc all the energy for a minute is associated with a single mode. The JSON is like that too, so it’s misleading because the pump might do both types of thing in the same minute when it’s switching over.

You might find that CSV report useful to analyse your friend’s system if you can get it from MELCloud @TrystanLea . I can’t remember if you said they had the MMSP setup, I suspect not because you are chatting to them about monitoring. I don’t know if it drops to hourly if they don’t have the MMSP or if it does something else.

Oh gosh.

I have that look on my face that people have when they get a heat pump and it’s using a lot of electricity.

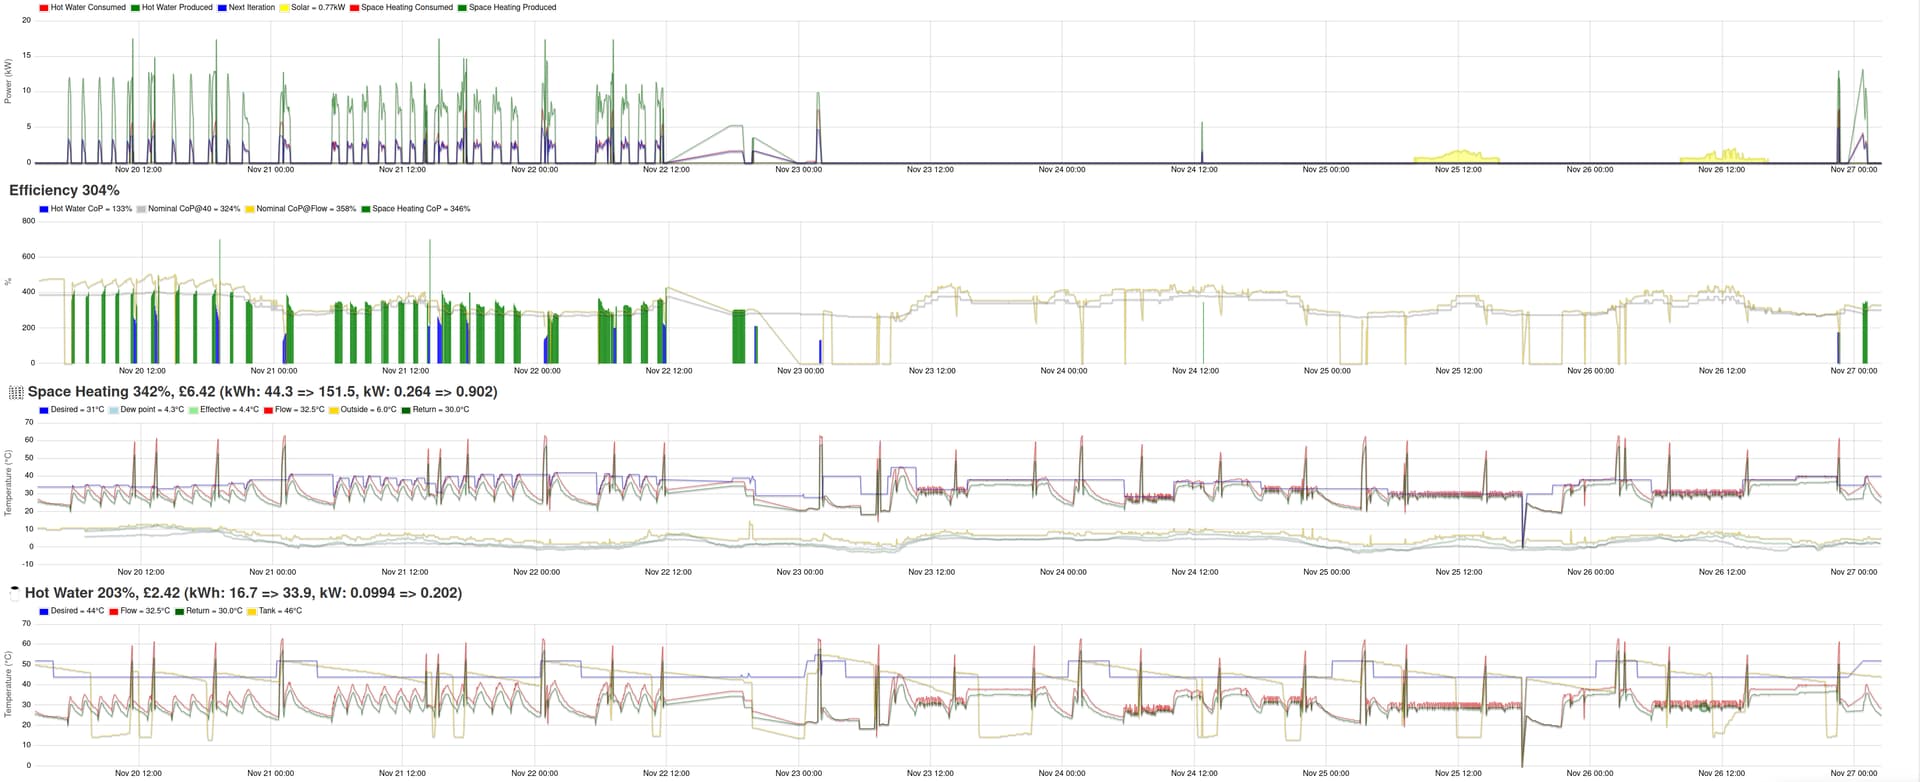
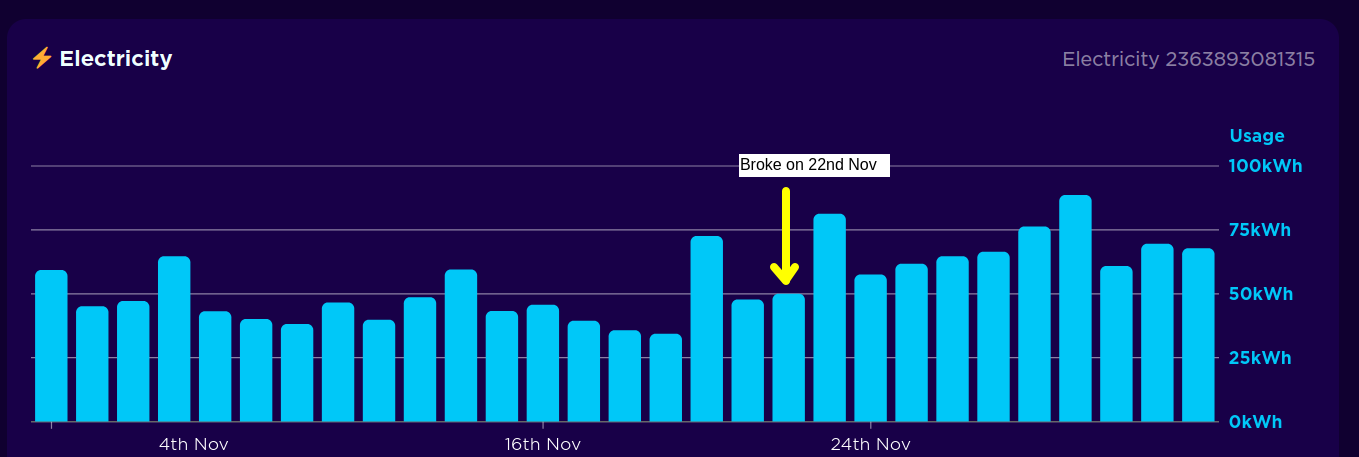
The monitoring broke on 2021-11-22 so the heat pump has been going a bit wild since then.

It looks even more dramatic because the car used a lot of power on the 23rd.

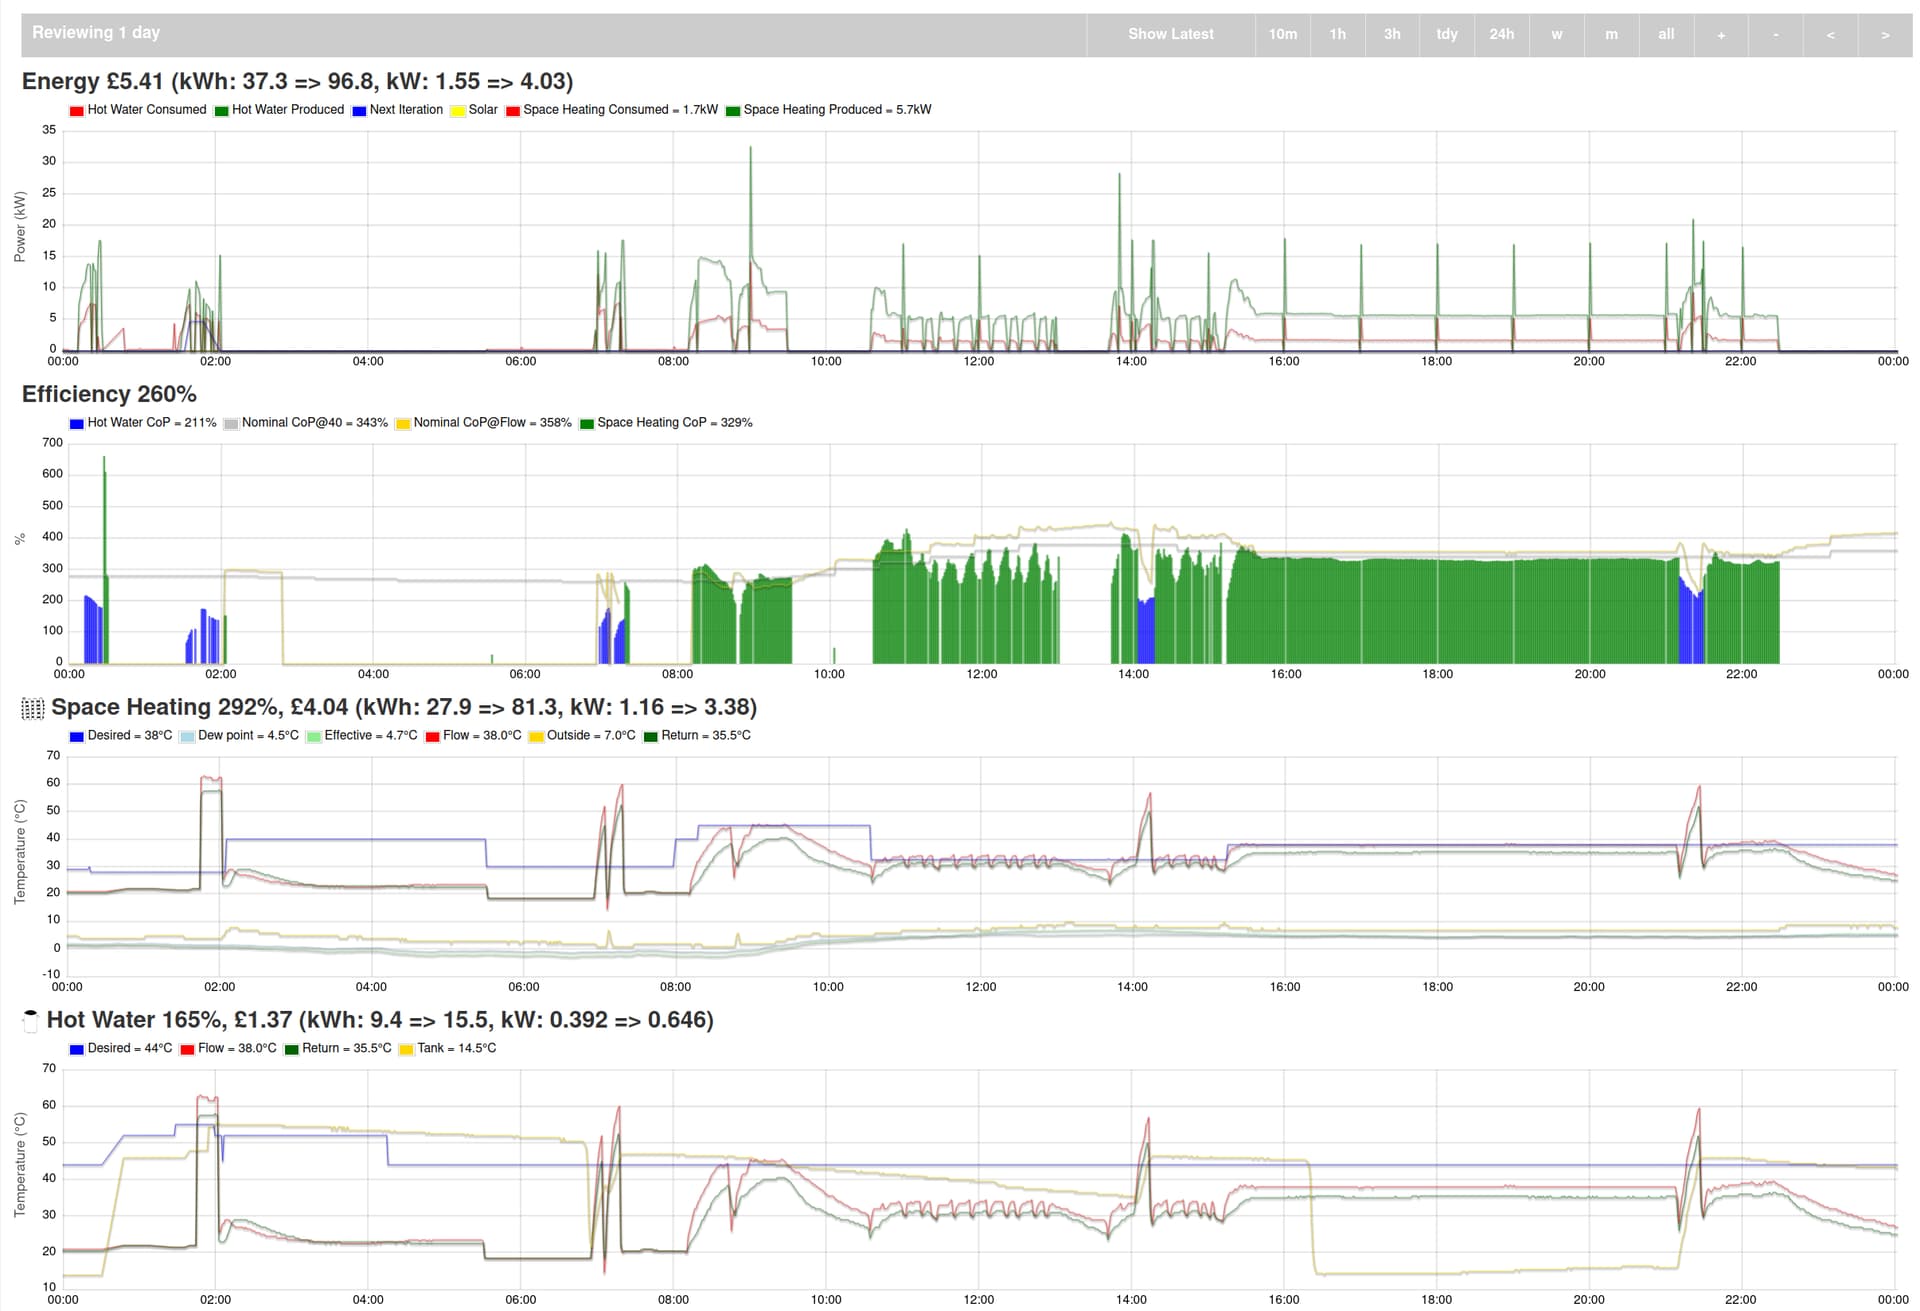
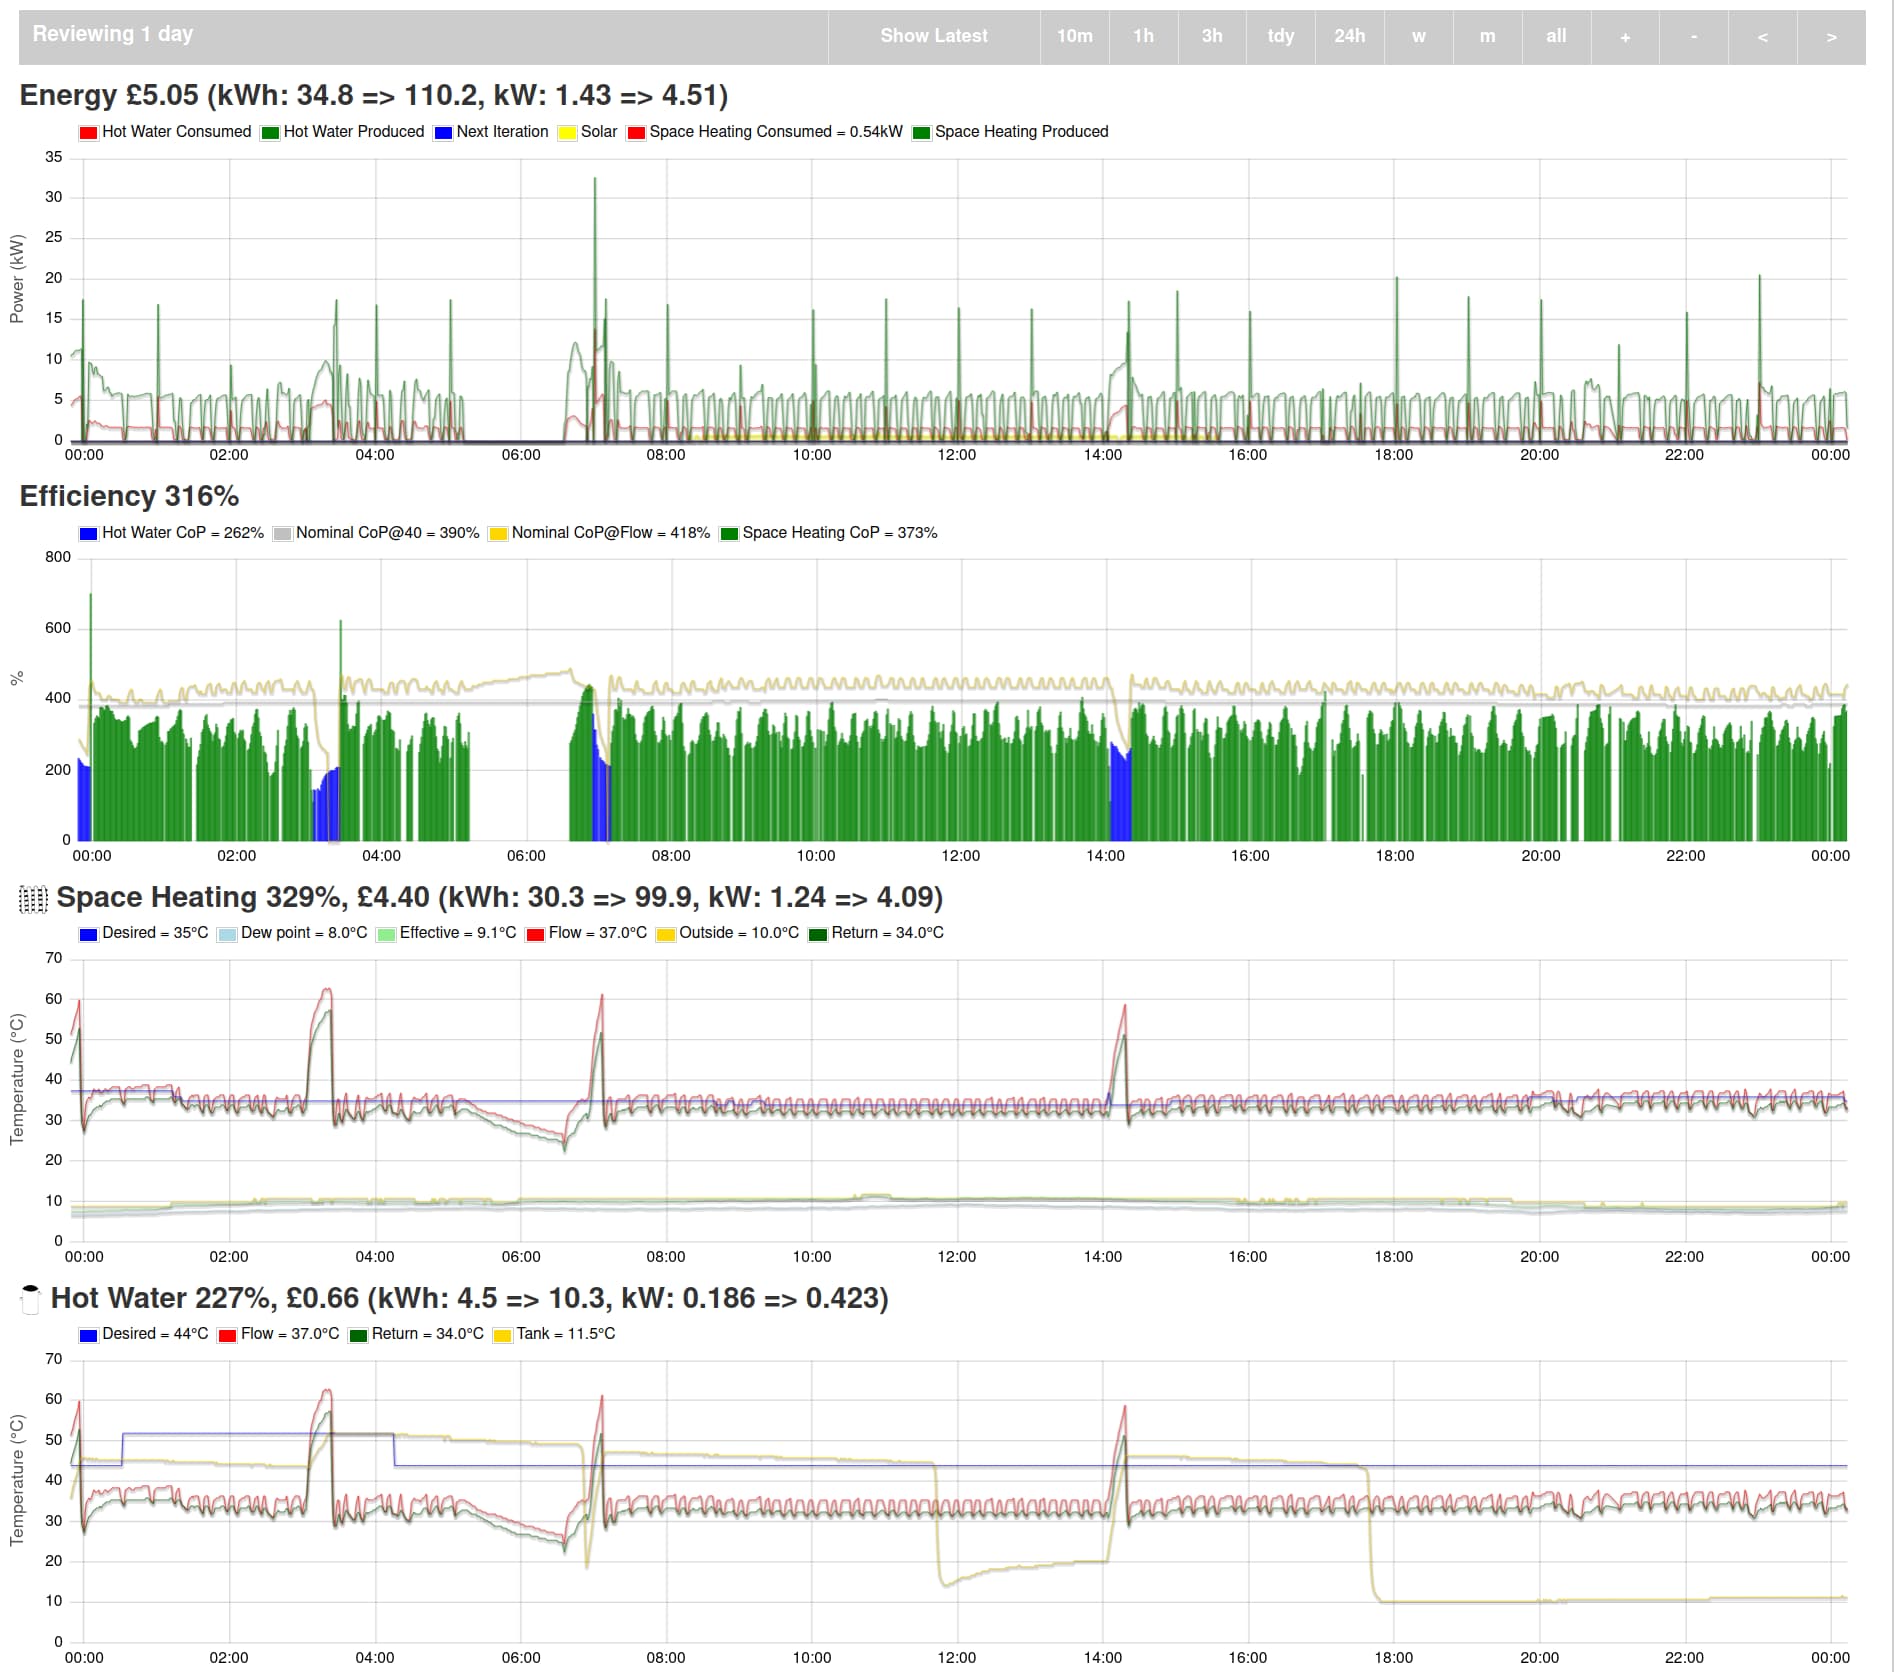
Now I have energy data we can see on the 23rd that it was cycling in the morning and then the desired flow went up to 38 °C and it tootled along running continuously.

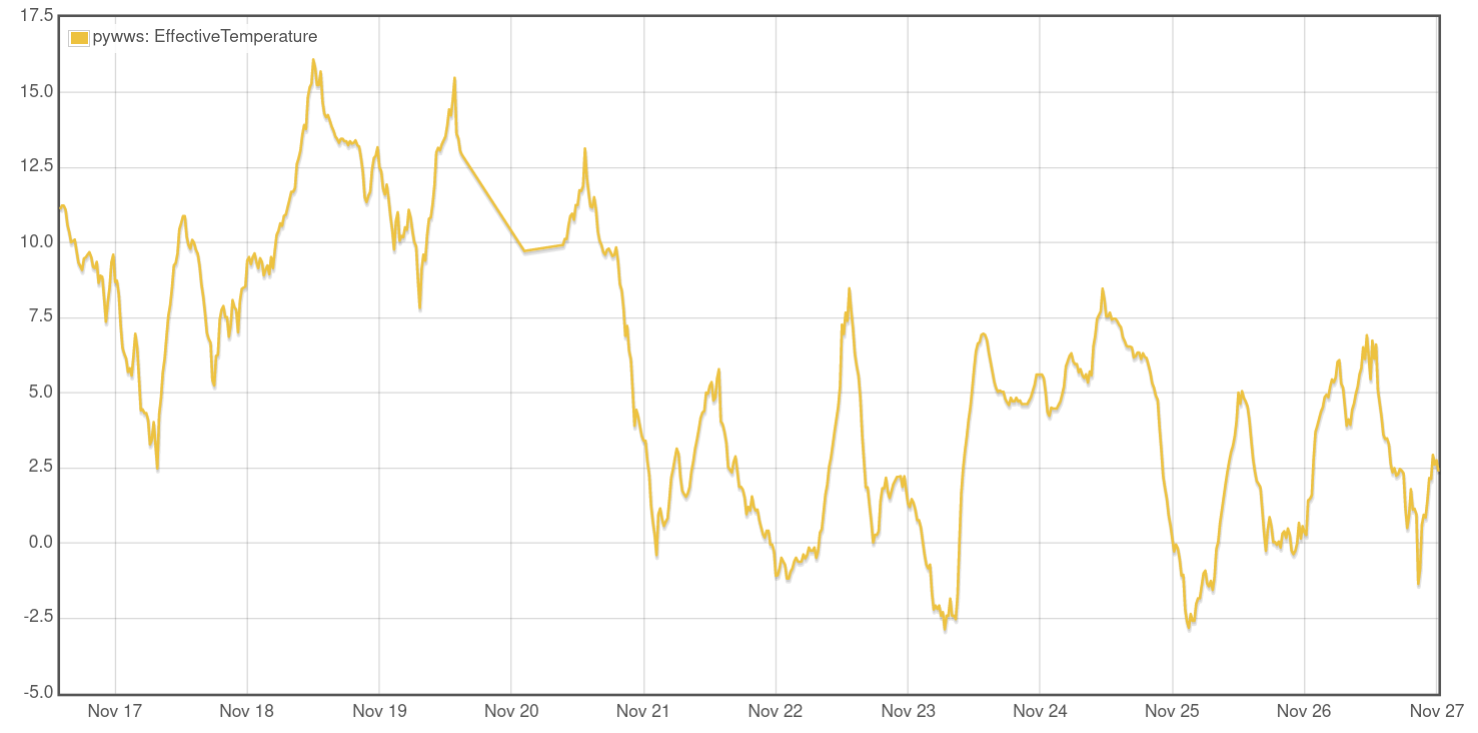
Now I know the rest of you run your heat pumps all the time, but I am totally not used to this. It was using 1.7kW. I can’t believe it just sat there running using 1.7kW continuously. The effective temp at that time was a pretty constant 4.5 °C.

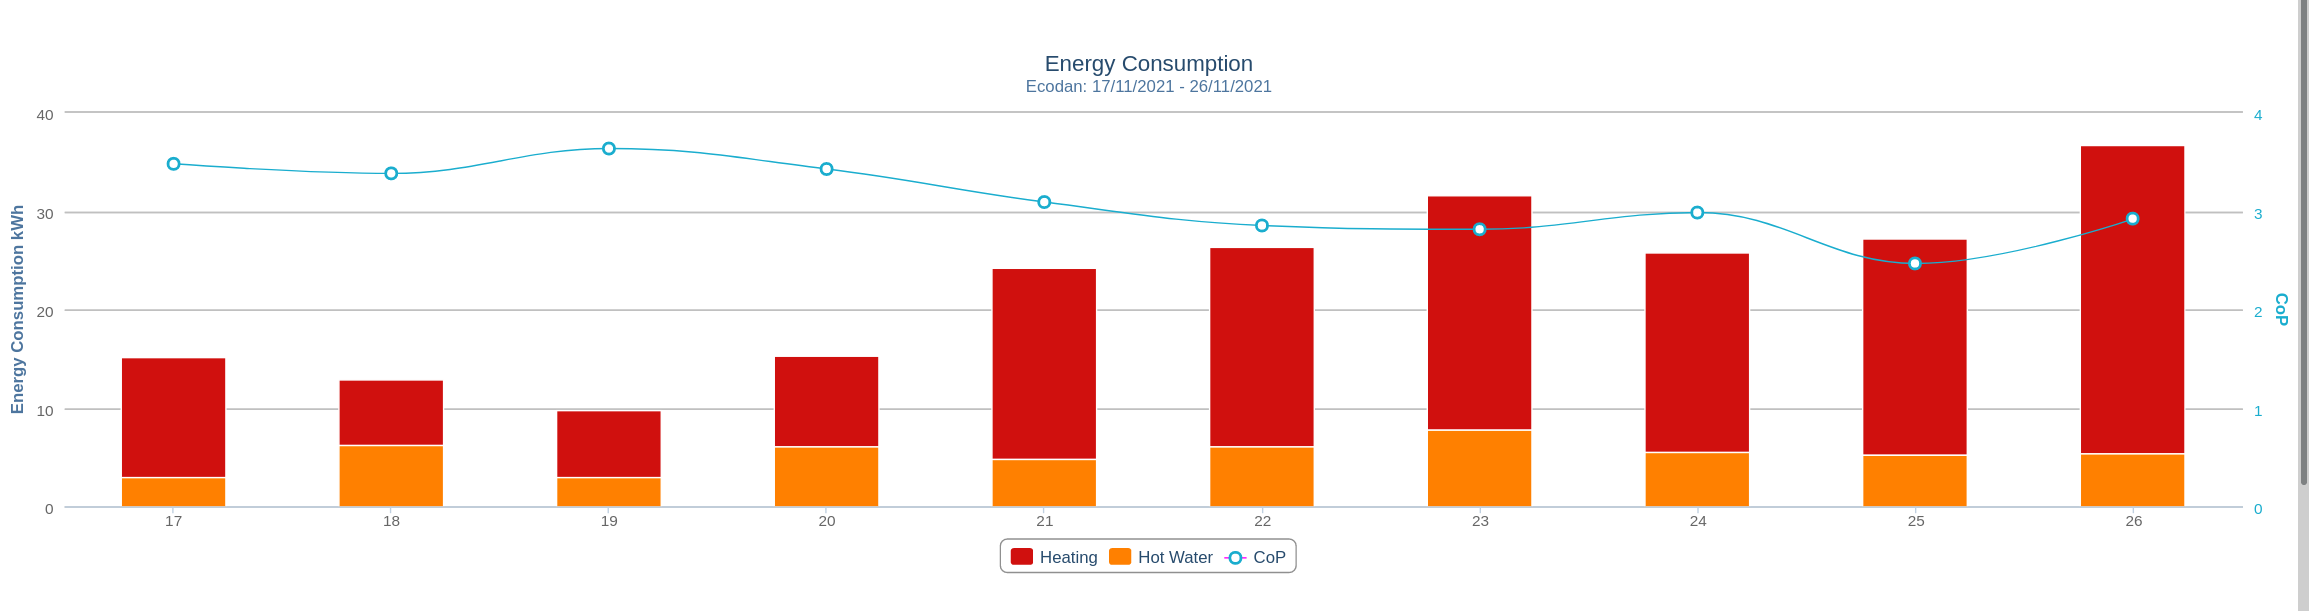
So between 16:00 and 20:00 it used 7.4kWh @ 330% efficiency => 24.5kWh.

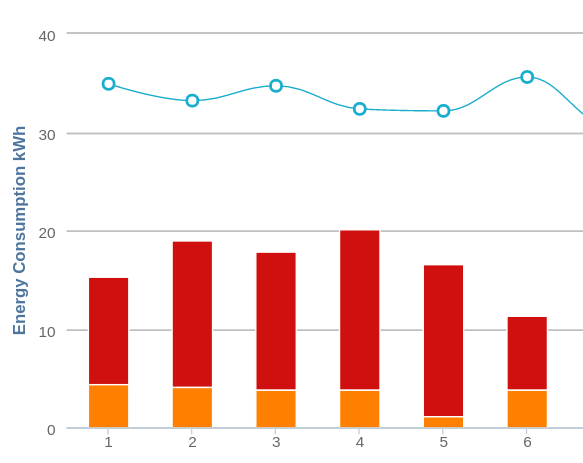
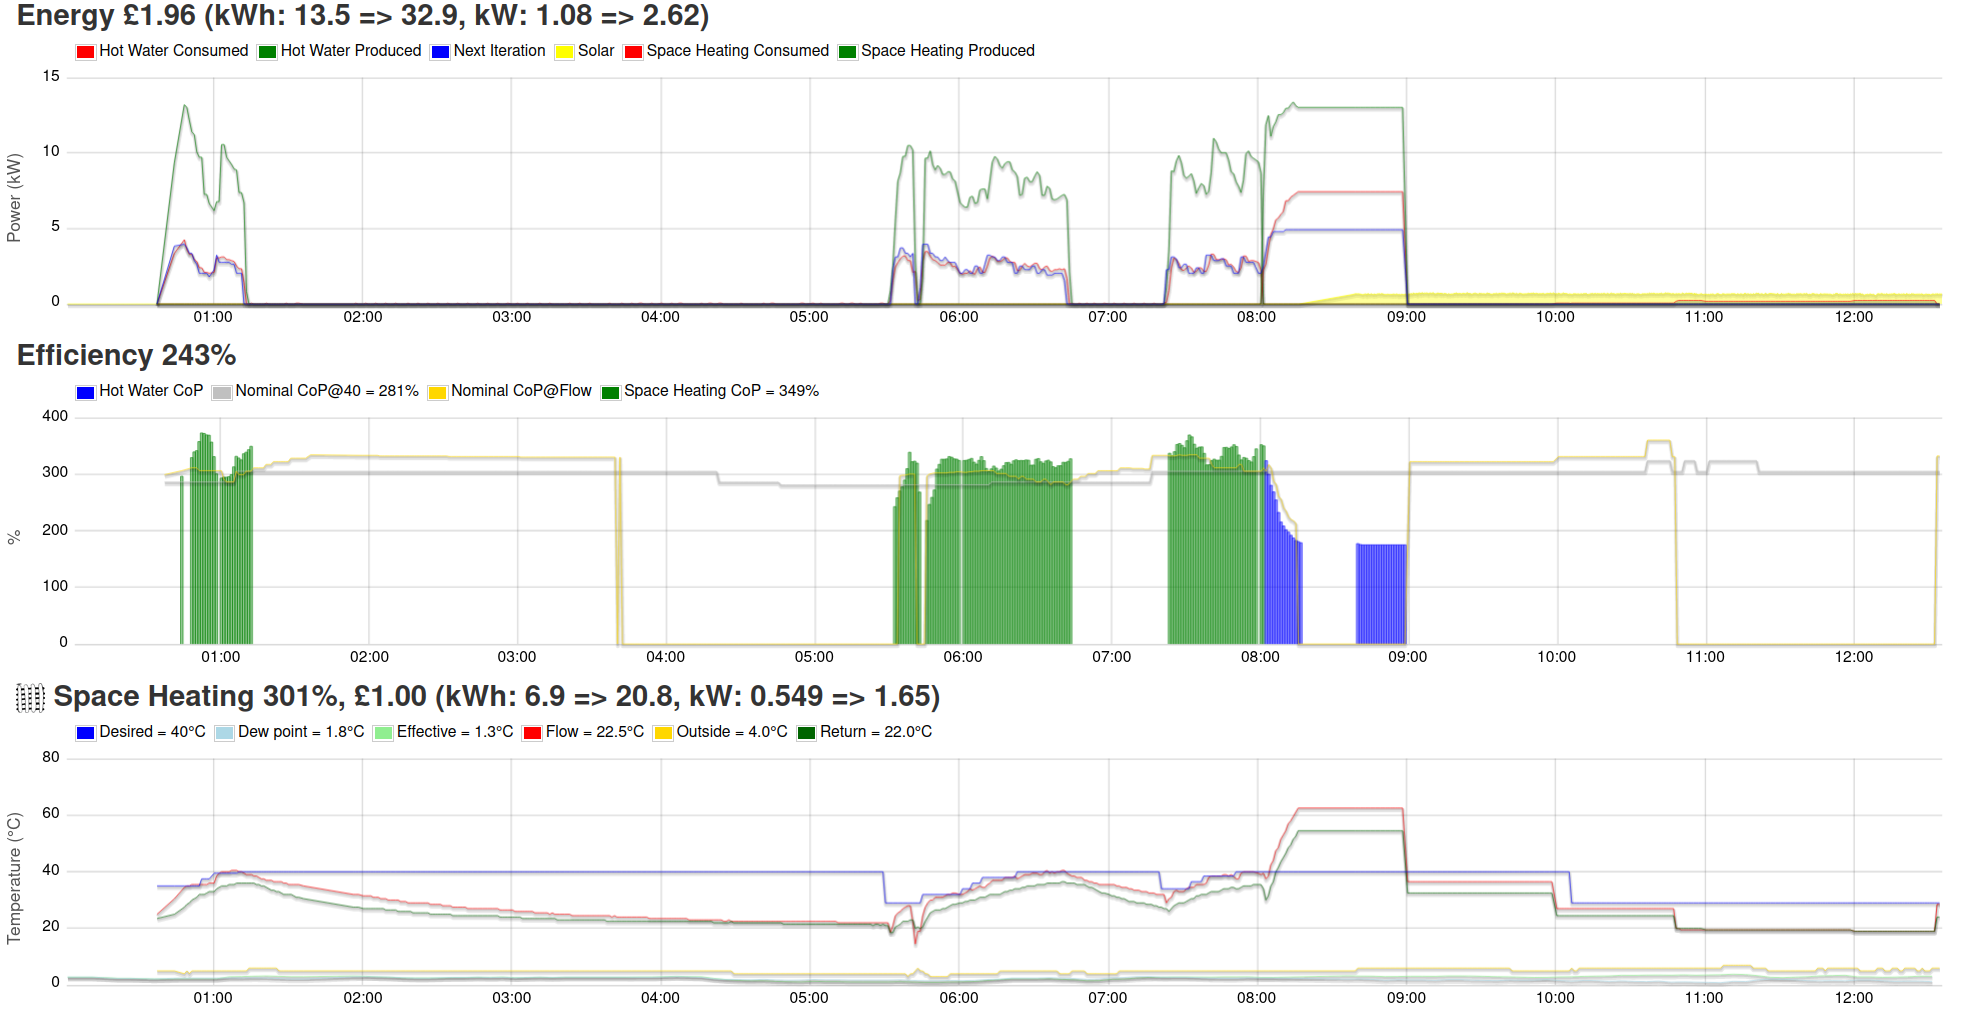
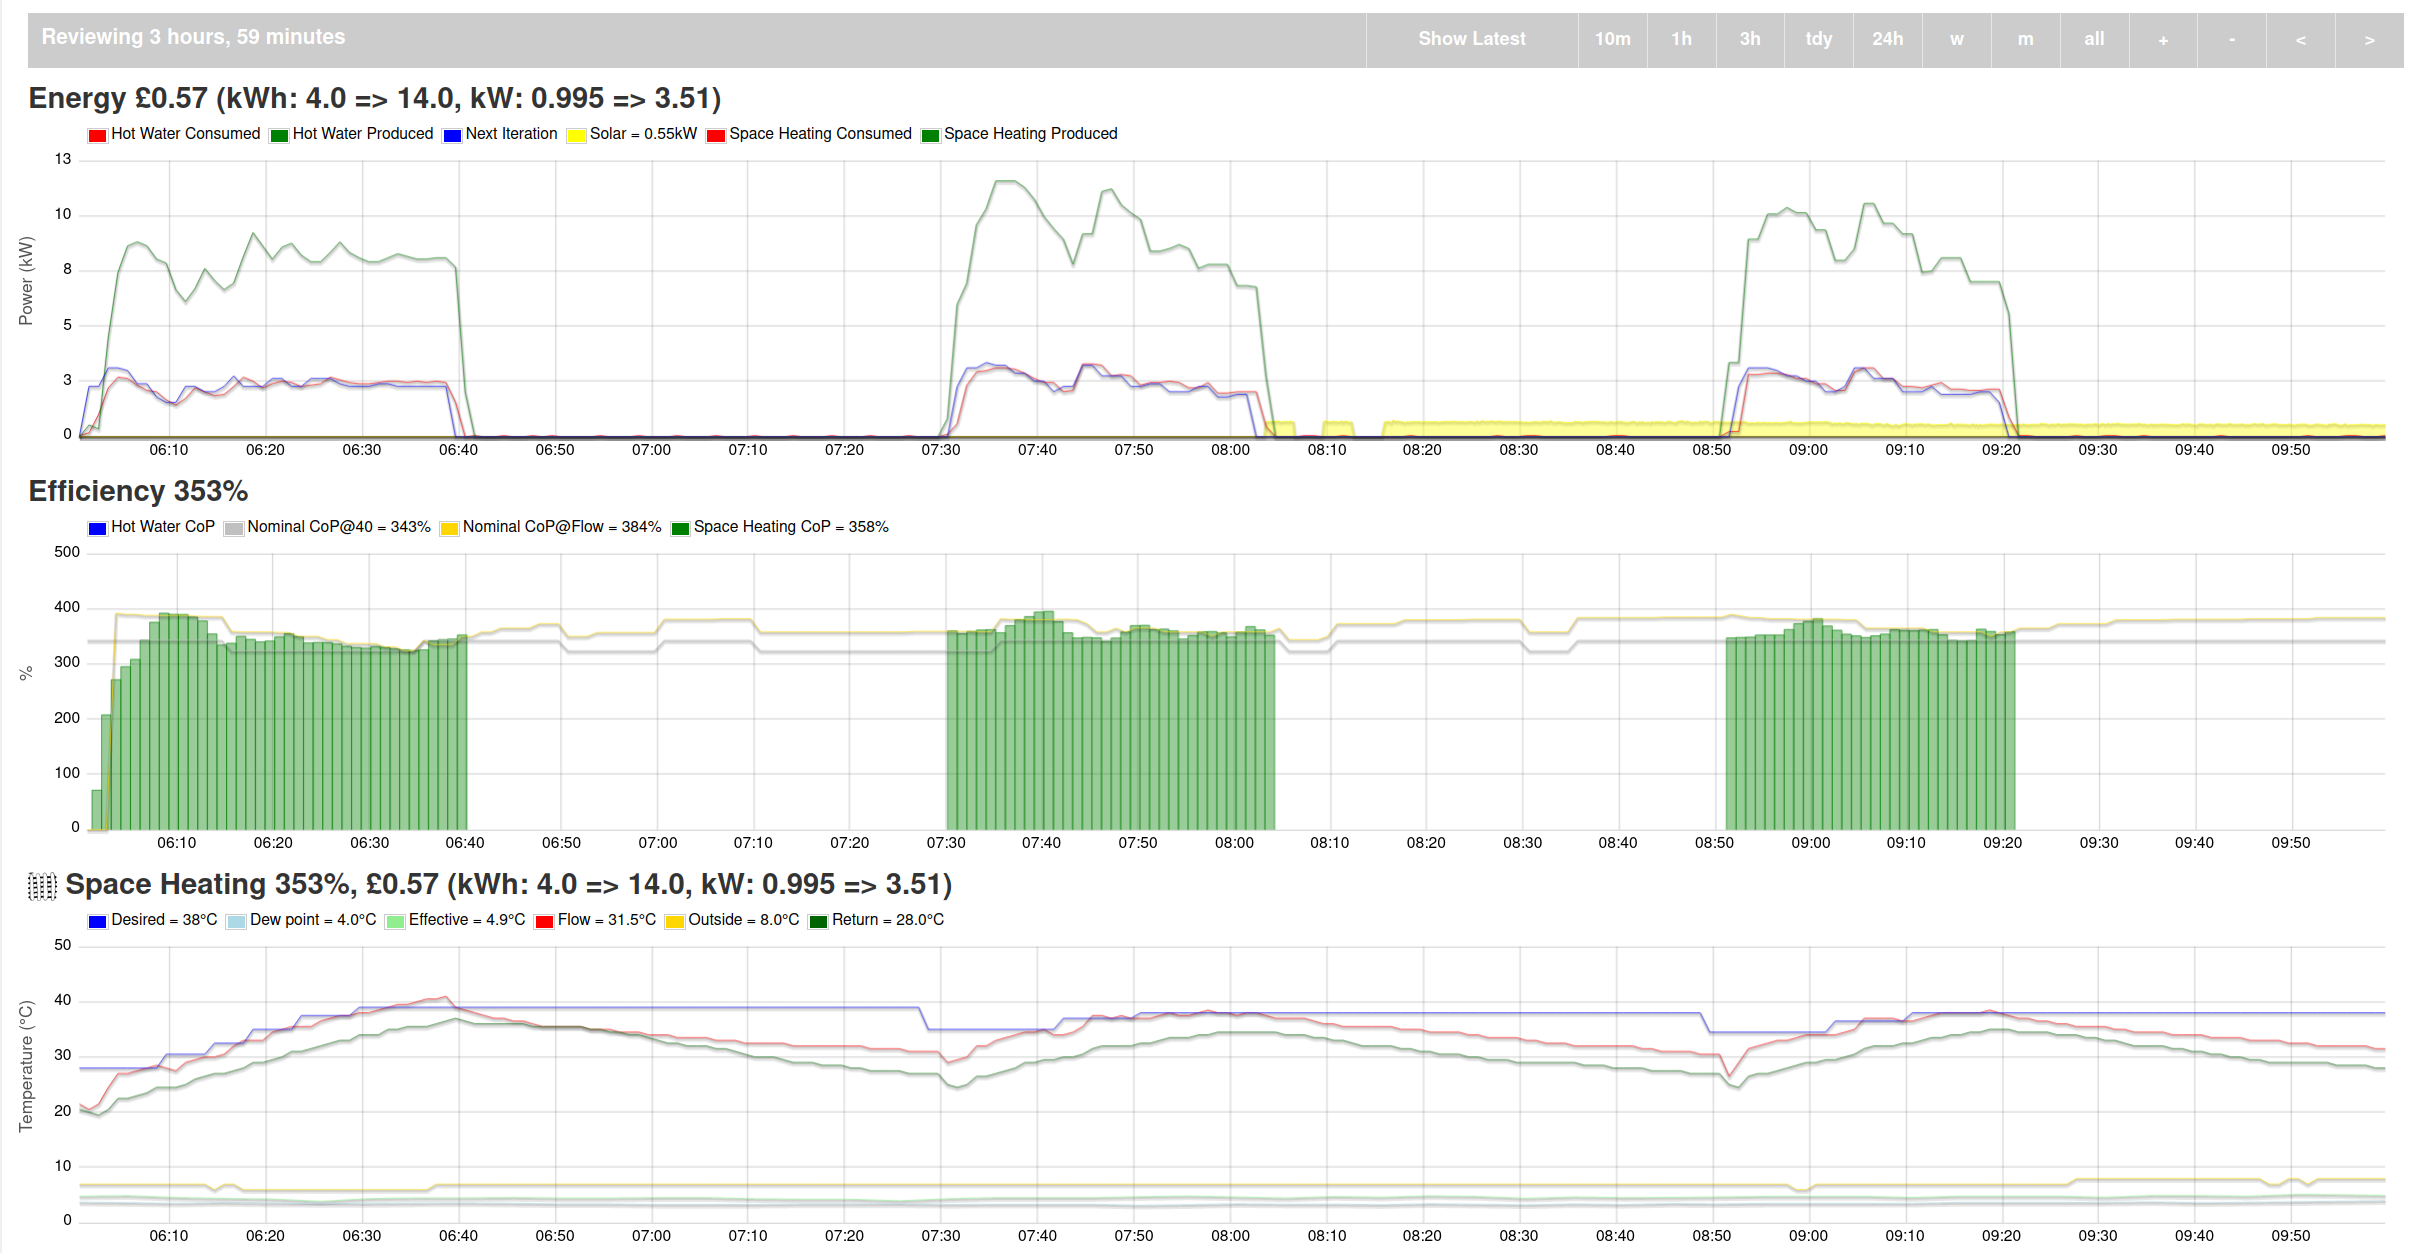
I found a similar 4 hour window on November 22nd last year as it happens. Here’s how that played out in a graph. It used 4kWh @ 353% efficiency => 14kWh. So that’s about half the cost and the humans were happy enough last year.

The runs from last year were at a higher load (~2.5kW) but managed to get the heat pump into a happier place.

So I’m now even more convinced that if you have an over-sized pump like mine then running it continuously is a bad idea. It just produces way too much heat.

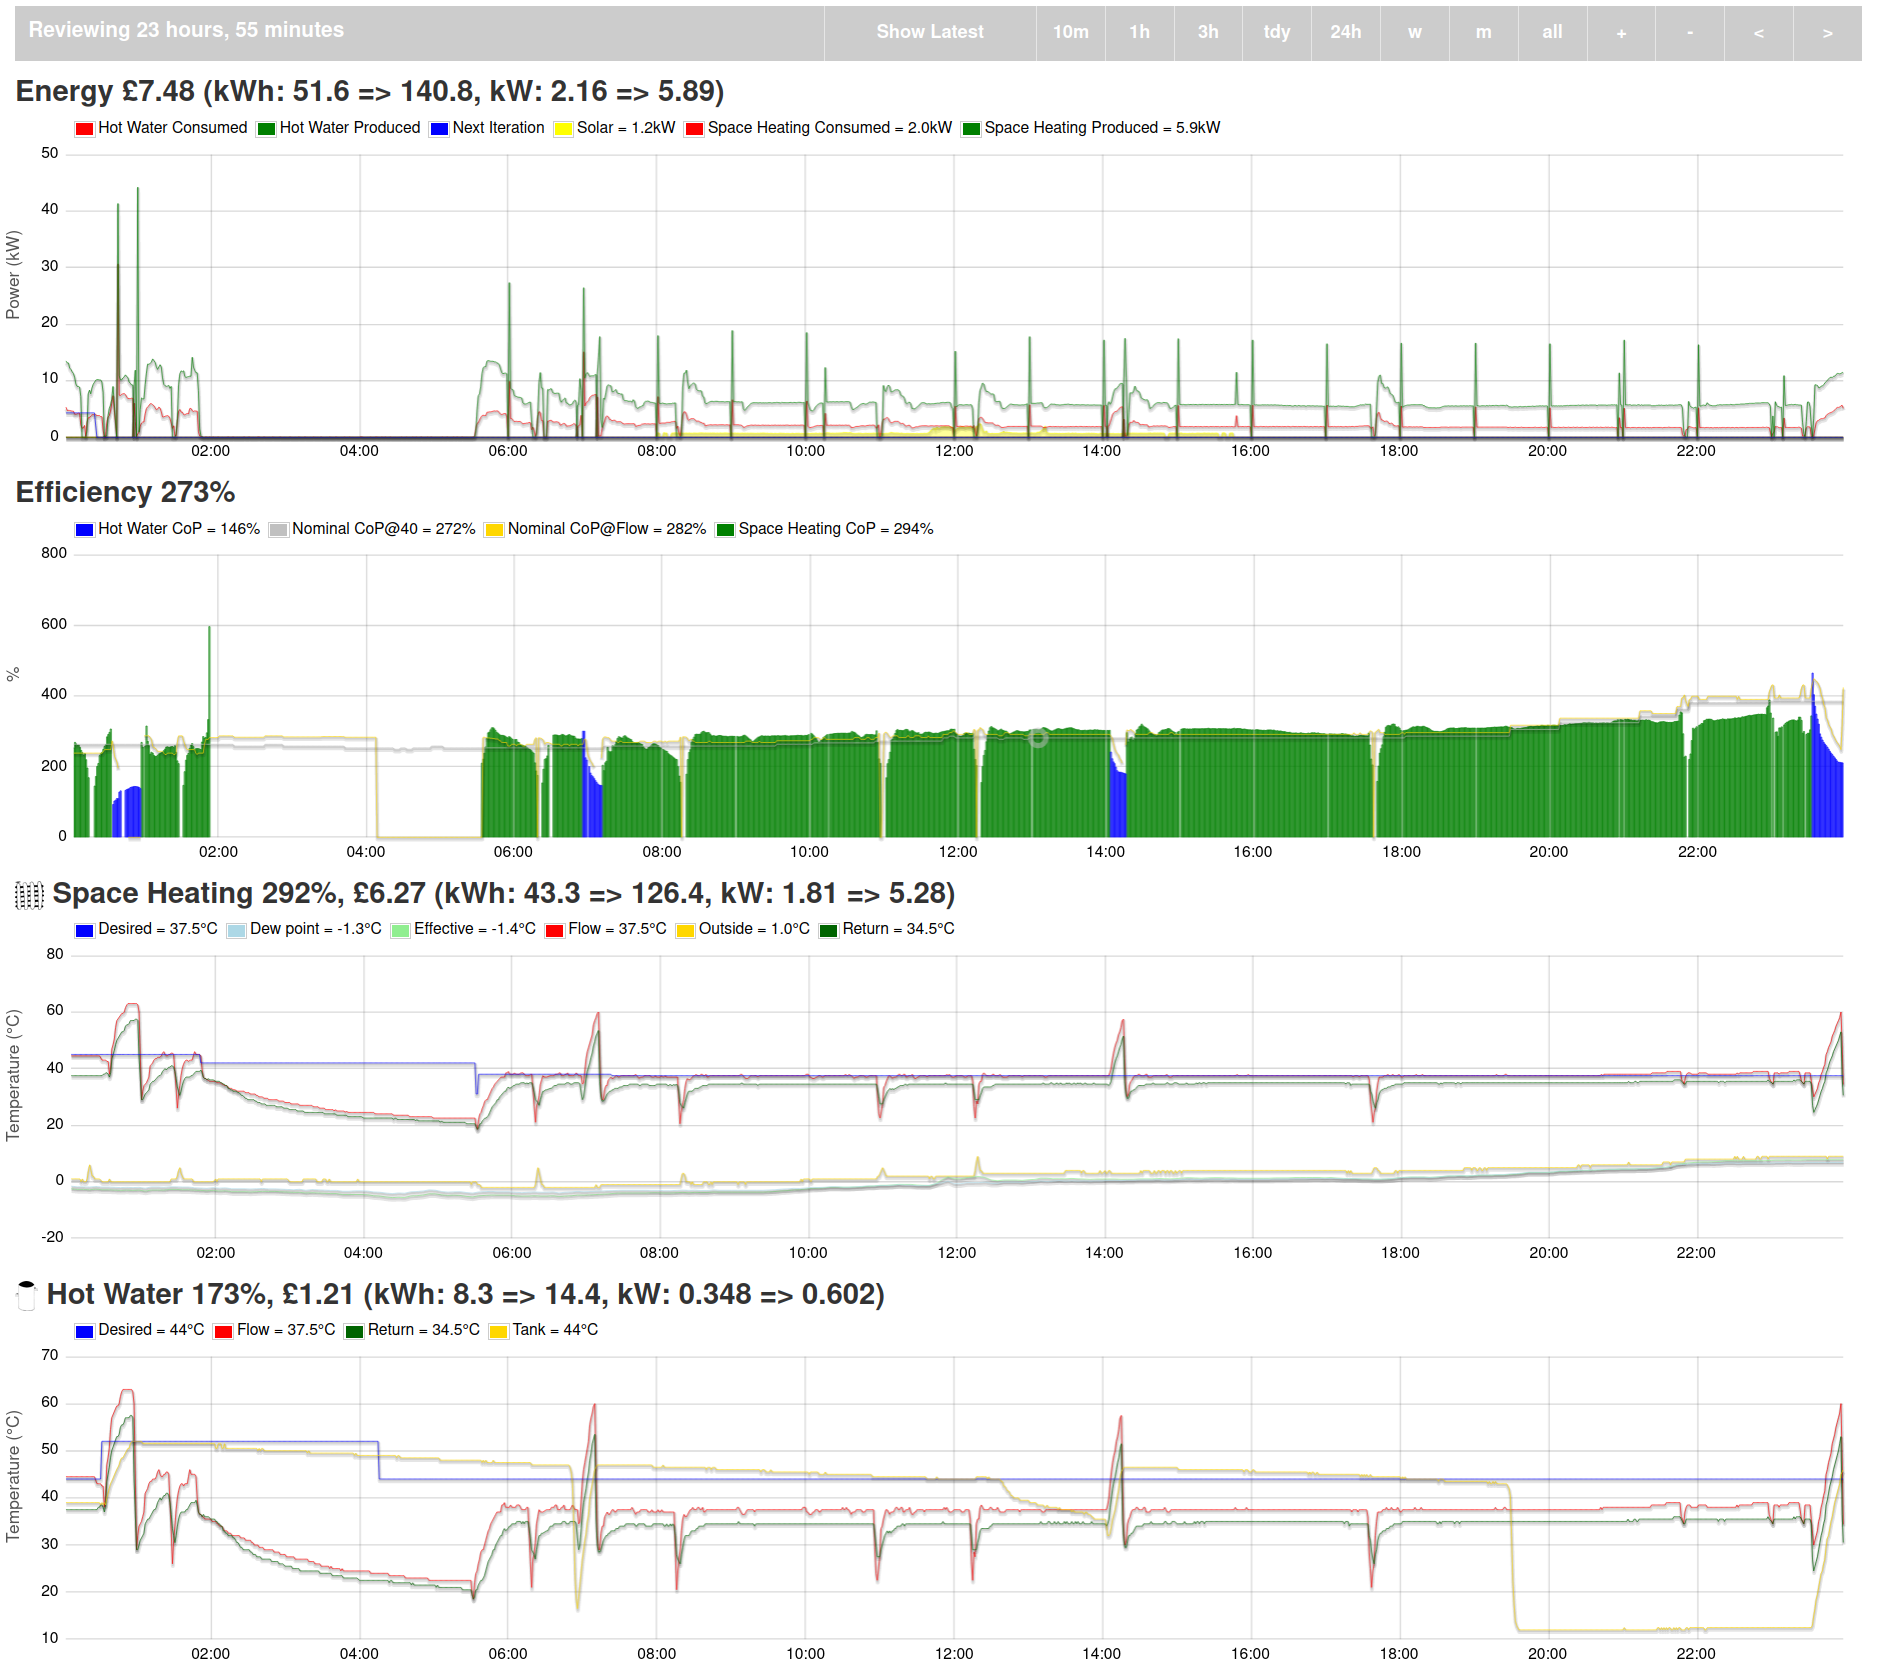
Here’s another interesting example. The pump ran pretty much the whole of the 29th November. It was a bit cold in UK terms (it was a few days after storm Arwen).

We can see the output was about 6kW. So one would deduce that heat loss from our house is about 6kW at 0 °C on the heat pump gauge. Which shows that a 14kW is actually bigger than we need. Of course it’ll get less efficient when it’s even colder but we do need something keeping us warm if it ever goes down to that crazy -16 °C we had in 2010. I don’t know how you’d convince rural folk like me to choose something smaller and more efficient that might leave you in trouble.

BTW that 7.48GBP is about right, which is somewhat alarming. At least that’s going to motivate me to get the control algorithm coping with this current level of data. I’m now only really missing the “heat pump frequency” which is actually an indication of how much power the heat pump thinks it should use in the next minute. As you can imagine, that allows my algorithm to do things like spotting the heat pump is bored and simply switching it off instead of watching it cycle itself on and off. That worked much better than my old technique of simply watching to see if it had been running at the same flow temp for ages and just stopping it after an arbitrary duration.

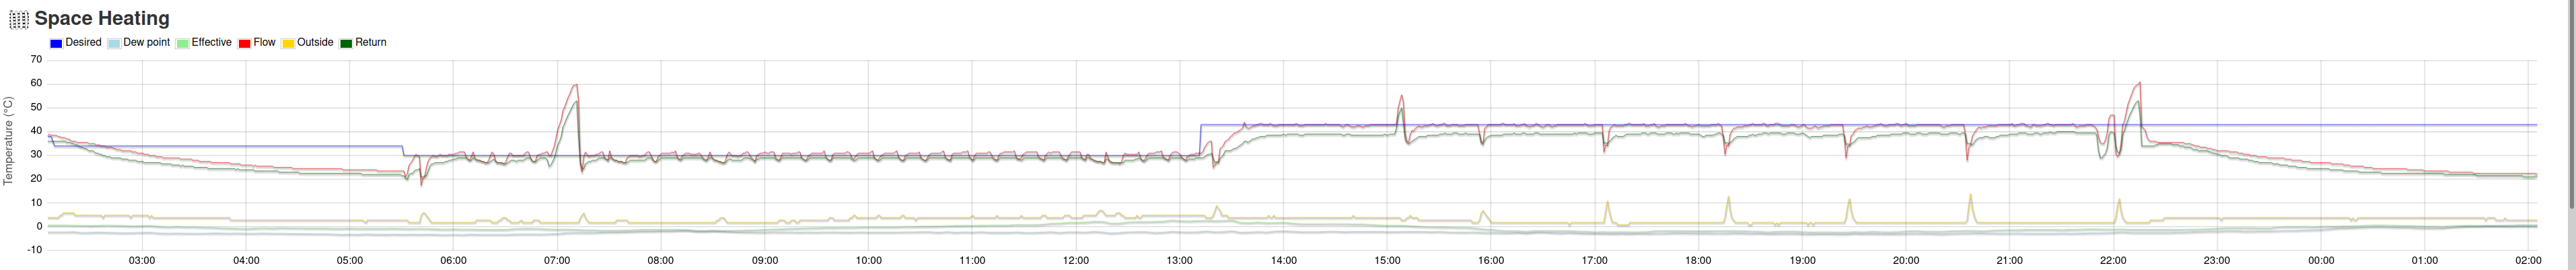
We certainly don’t want it to be cycling around like it did on 30th November: