Firstly, thanks JumpMaster for making this excellent app. I use it daily, but I often find myself switching feeds as I have 4 CT sensors (whole house, heating, water heating and laundry).
I was thinking that it would be fantastic to be able to select multiple kW and multiple kWh feeds, and have the values in a stacked chart (which I see that MPAndroidChart can do).
What do you think of this? If you didn’t have time yourself but think it’s a good idea, I’d be willing to break out the rusty Android skills and have a go.
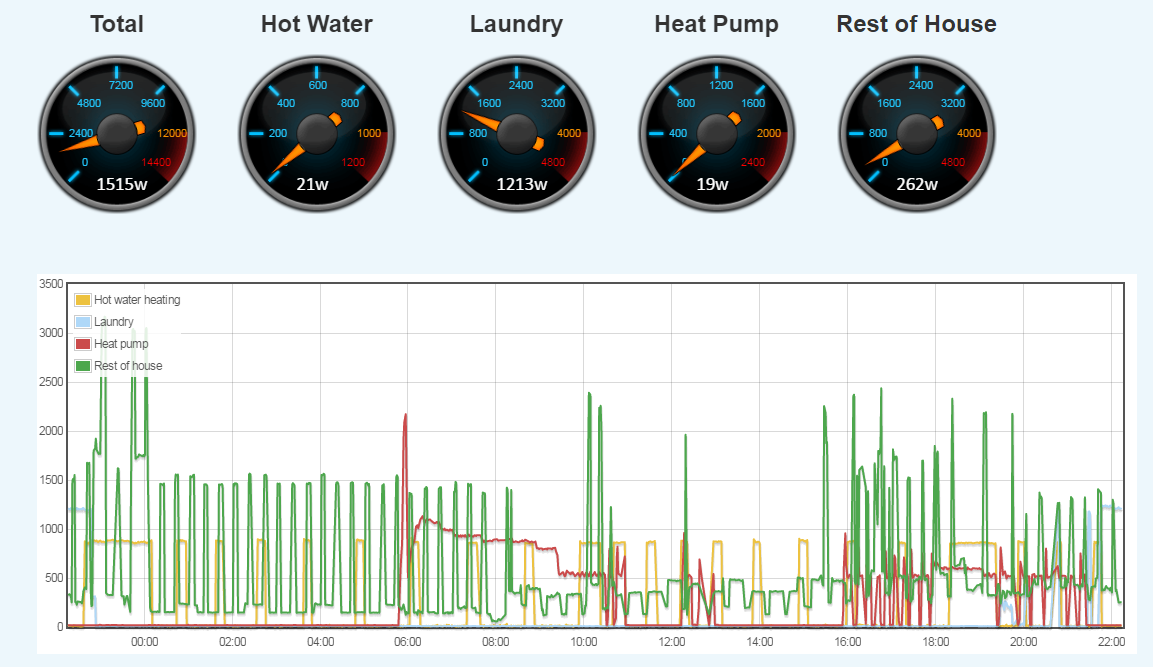
FWIW, emoncms itself doesn’t seem to support stacked charts (with more than two stacked things). The best I can do is my current dashboard:
Hi George,
I have a few code updates to multigraph to allow stacked charts (line & bar). I should be ready to submit a github PR in the next day or two. I’ll let you know when I’m done, you can then get it from my repository or wait & see if it gets accepted into the master.
Thanks,
Sandy
Thanks Dave. That’s an awesome dashboard. I really do want to try to get stacked charts though, so I can see clearly how the various components of the power usage make up the whole each day.
Hi George,
On github, I’m also blaal02. But I just submitted PR 529 to Emoncms · GitHub.
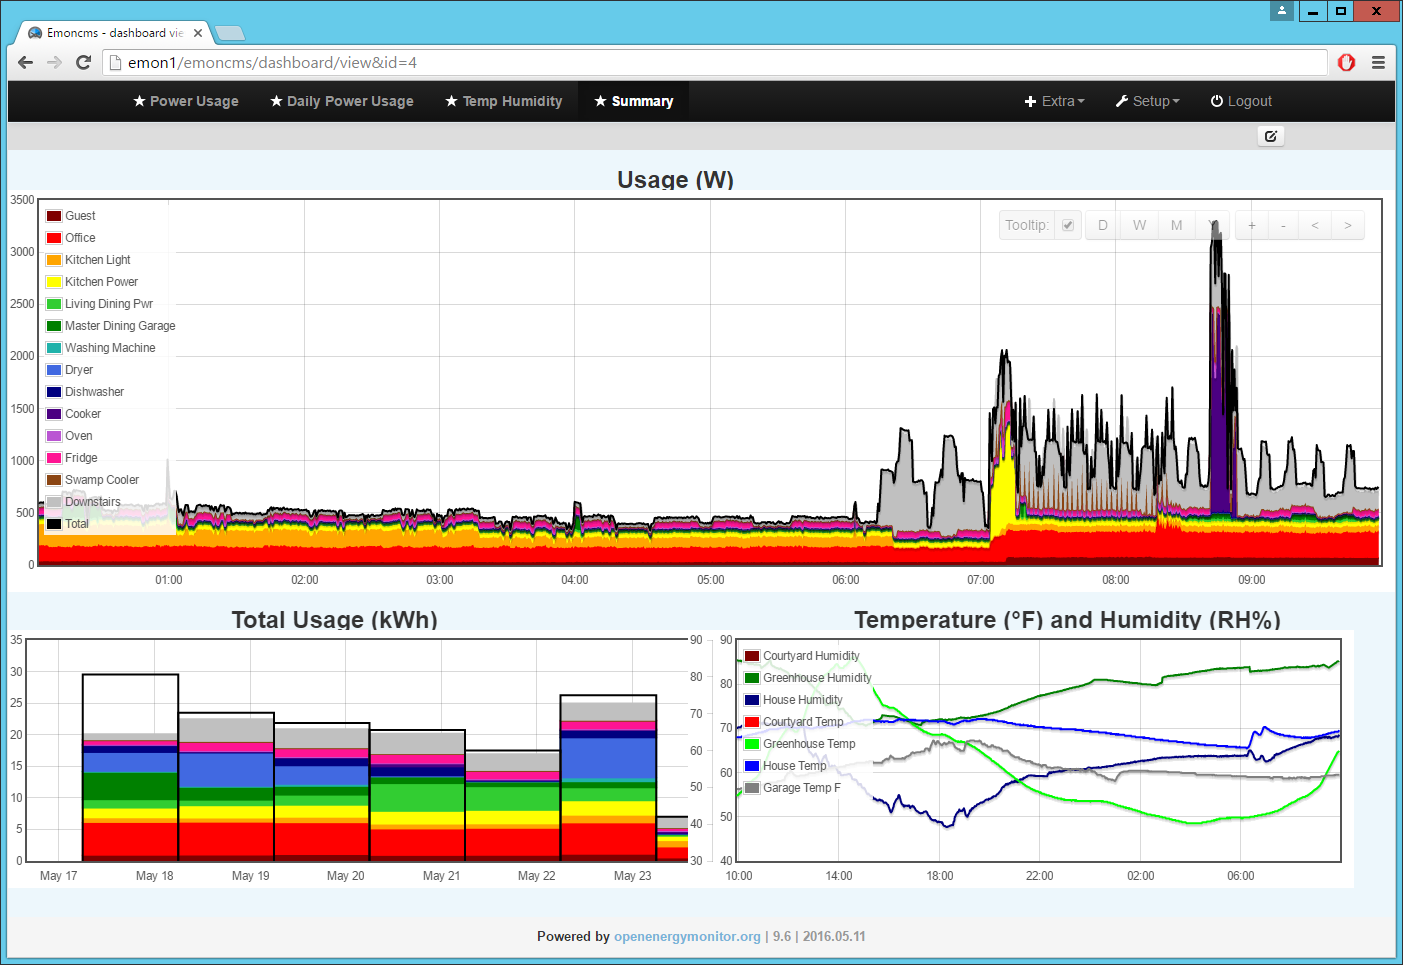
Here’s what my dashboard looks like - this the kind of thing you were wanting?