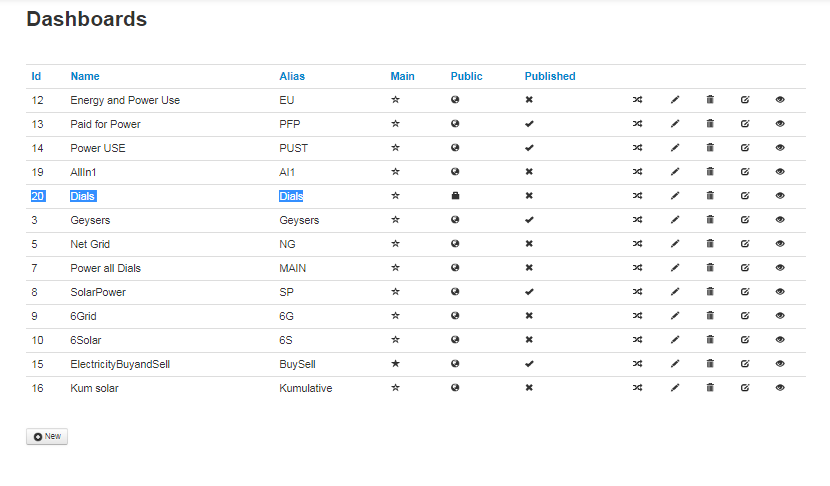
I used to have a couple of dashboards reporting PV power produced / Power used in house and surplus fed back into the grid.
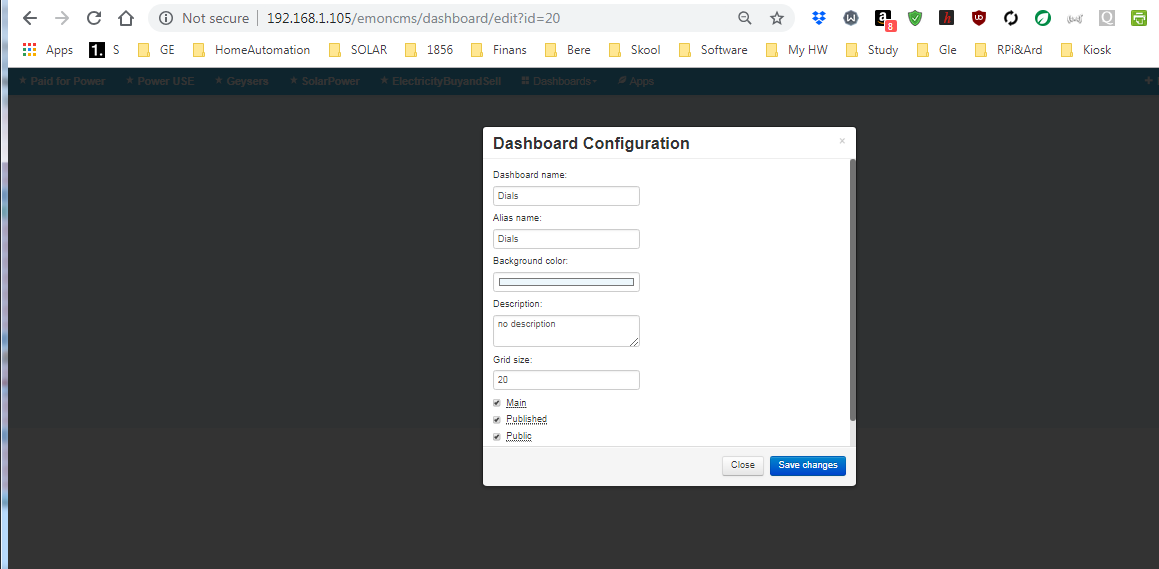
So I wanted to make sure all is up to date in the administration Menu option and decided it is probably good to run an update on “emonPi” -
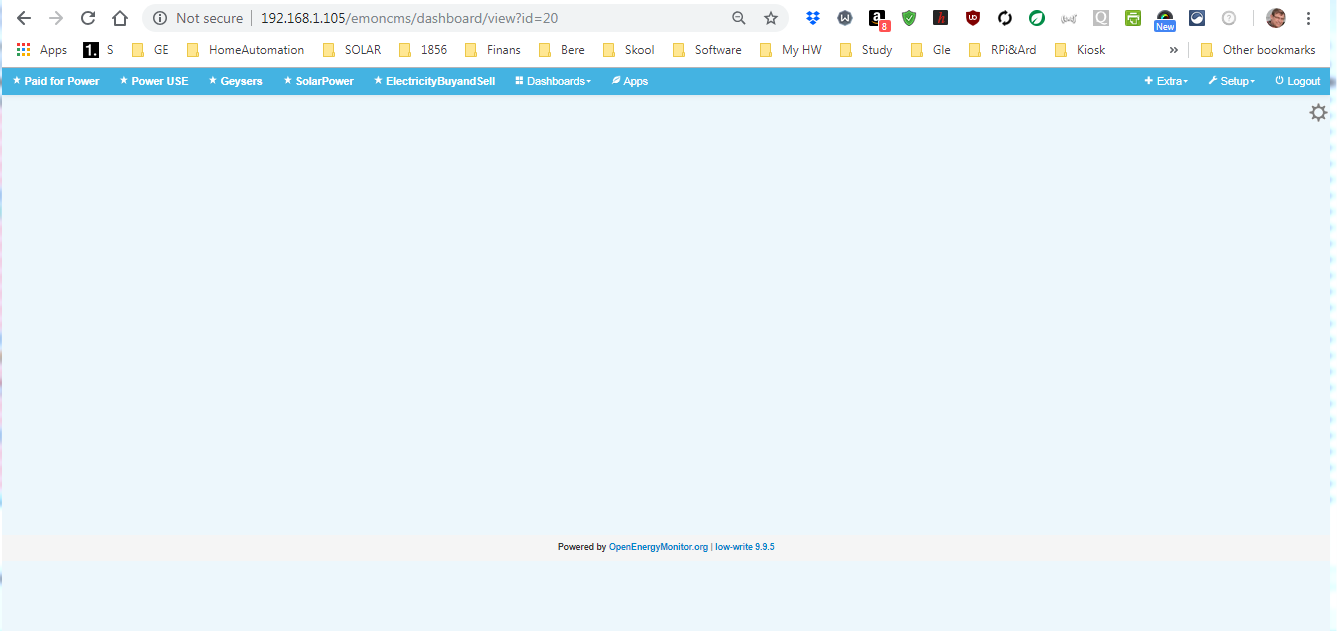
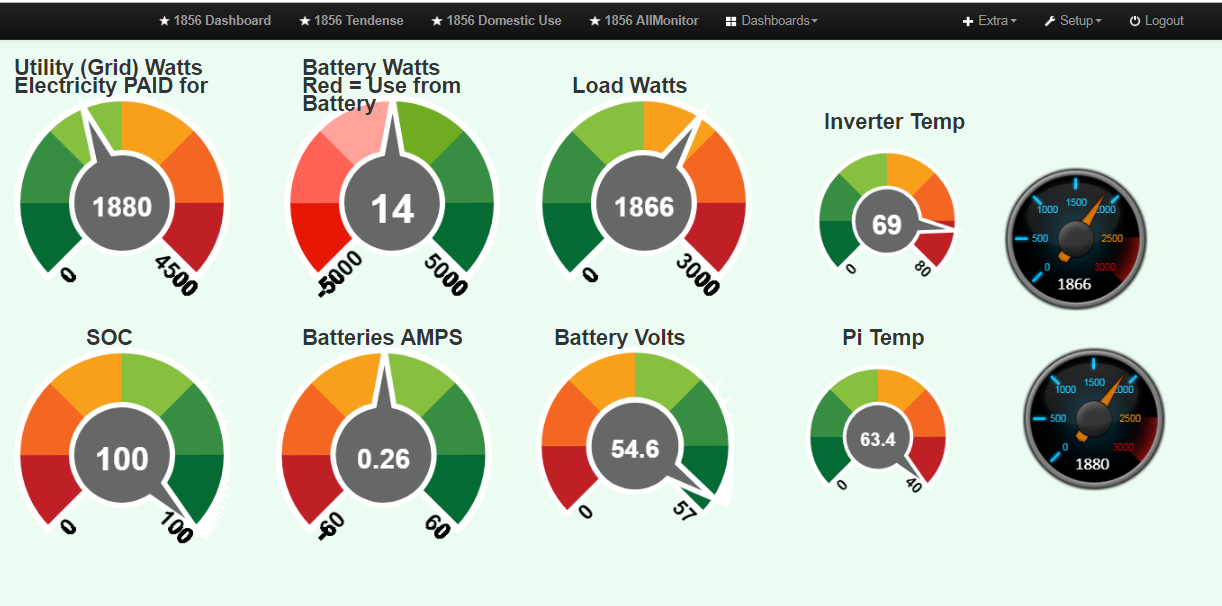
Gone are all my nice dials I used to have.
No matter what I tried after that, I am not able to get them to show up again. Am I just doing something wrong, OR was the dials etc removed in recent update 9.9.3 (The one I updated to)
Below is an example of such a dashboard reading my Axpert inverter and not the emonCMS, illustrating some of the info I would love to have back:
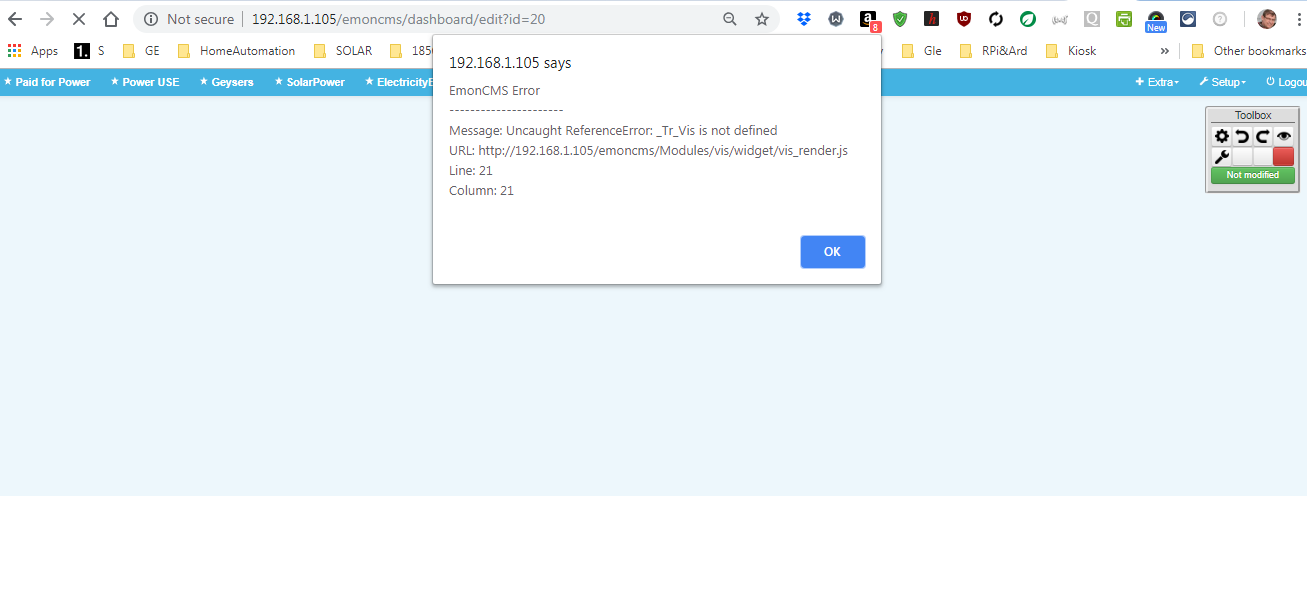
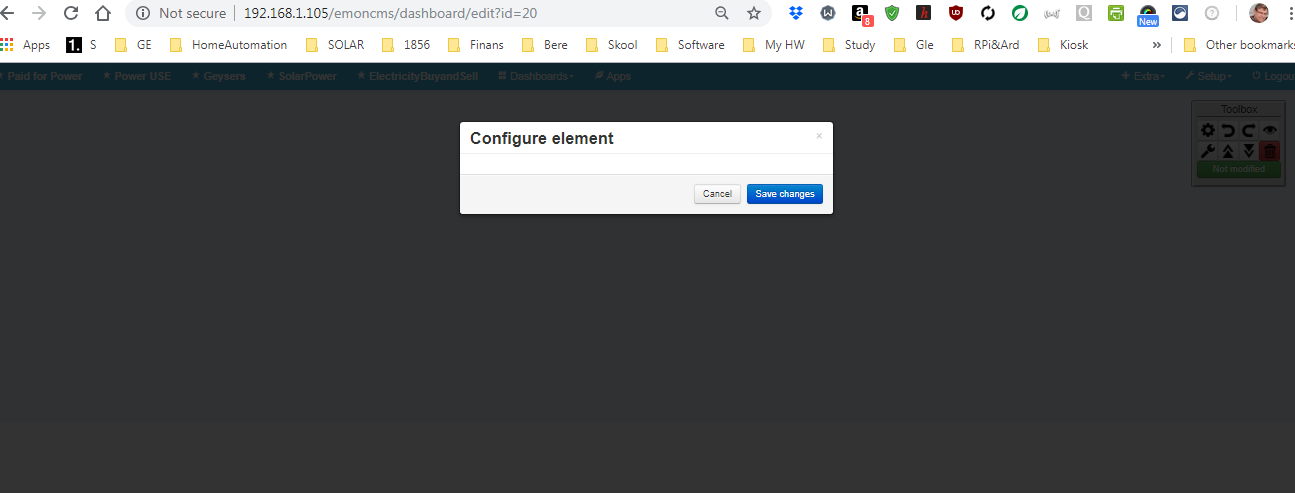
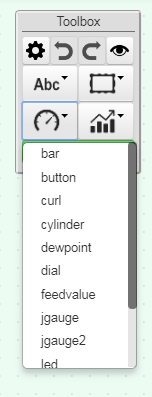
Below is a screenshot of the Toolbox how it used to be before; now the options are not there any more:
Can anyone perhaps give me some pointers how to get the dials and real time values back on the dashboards?
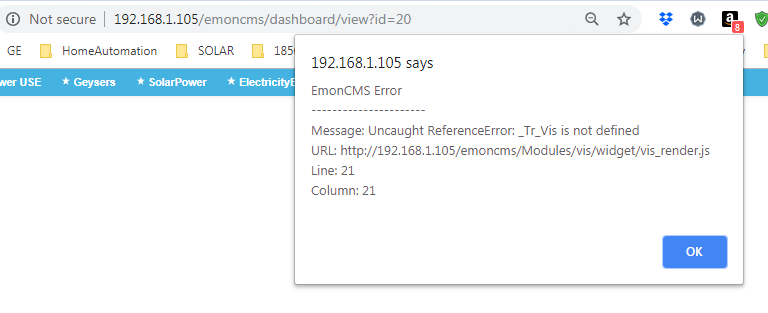
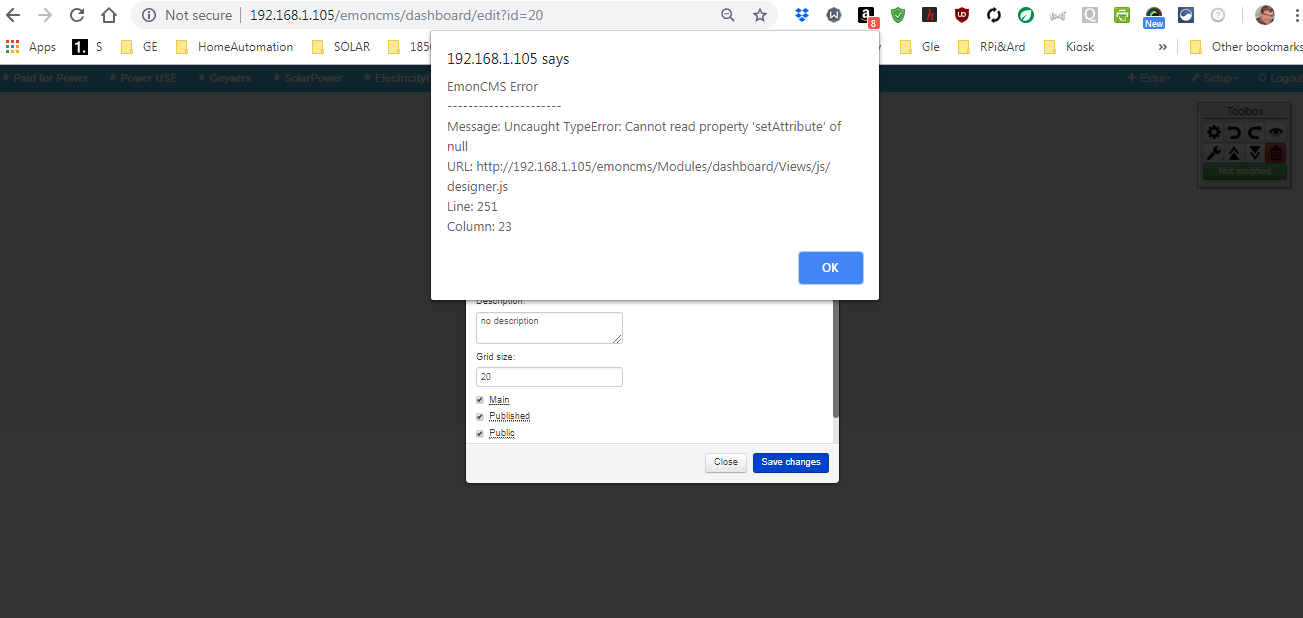
I am watching this video:

and when trying to follow the video, I get this message:
Perhaps that is a clue:

So going to the URL on the image this is what I got out:
    /*
   All emon_widgets code is released under the GNU General Public License v3.
   See COPYRIGHT.txt and LICENSE.txt.

   Part of the OpenEnergyMonitor project:
   http://openenergymonitor.org

   Author: Trystan Lea: [email protected]
   If you have any questions please get in touch, try the forums here:
   http://openenergymonitor.org/emon/forum
 */

function vis_widgetlist(){
  var widgets = {
    "realtime":
    {
      "offsetx":0,"offsety":0,"width":400,"height":300,
      "menu":"Visualisations",
      "options":["feedid","colour","initzoom"],
      "optionstype":["feedid","colour_picker","dropbox"],
      "optionsname":[_Tr_Vis("Feed"),_Tr_Vis("Colour"),_Tr_Vis("Zoom")],
      "optionshint":[_Tr_Vis("Feed source"),_Tr_Vis("Line colour in hex. Blank is use default."),_Tr_Vis("Default visible window interval")],
      "optionsdata": [ , , [["1", "1 "+_Tr_Vis("minute")],["5", "5 "+_Tr_Vis("minutes")],["15", "15 "+_Tr_Vis("minutes")],["30", "30 "+_Tr_Vis("minutes")],["60", "1 "+ _Tr_Vis("hour")]] ],
      "html":""
    },

    "rawdata":
    {
      "offsetx":0,"offsety":0,"width":400,"height":300,
      "menu":"Visualisations",
      "options":["feedid","colour","units","dp","scale","fill","initzoom"],
      "optionstype":["feedid","colour_picker","value","value","value","value","dropbox"],
      "optionsname":[_Tr_Vis("Feed"),_Tr_Vis("Colour"),_Tr_Vis("units"),_Tr_Vis("dp"),_Tr_Vis("scale"),_Tr_Vis("Fill"),_Tr_Vis("Zoom")],
      "optionshint":[_Tr_Vis("Feed source"),_Tr_Vis("Line colour in hex. Blank is use default."),_Tr_Vis("units"),_Tr_Vis("Decimal points"),_Tr_Vis("Scale by"),_Tr_Vis("Fill value"),_Tr_Vis("Default visible window interval")],
      "optionsdata": [ , , , , , , [["1", _Tr_Vis("Day")],["7", _Tr_Vis("Week")],["30", _Tr_Vis("Month")],["365", _Tr_Vis("Year")]] ],
      "html":""
    },

    "bargraph":
    {
      "offsetx":0,"offsety":0,"width":400,"height":300,
      "menu":"Visualisations",
      "options":["feedid","colour","interval","units","dp","scale","delta","mode","initzoom"],
      "optionstype":["feedid","colour_picker","value","value","value","value","boolean","boolean","dropbox"],
      "optionsname":[_Tr_Vis("Feed"),_Tr_Vis("Colour"),_Tr_Vis("Interval"),_Tr_Vis("units"),_Tr_Vis("dp"),_Tr_Vis("scale"),_Tr_Vis("delta"),_Tr_Vis("mode"),_Tr_Vis("Zoom")],
      "optionshint":[_Tr_Vis("Feed source"),_Tr_Vis("Line colour in hex. Blank is use default."),_Tr_Vis("Interval (seconds)-you can set \"d\" for day, \"m\" for month, or \"y\" for year"),_Tr_Vis("Units"),_Tr_Vis("Decimal points"),_Tr_Vis("Scale by"),_Tr_Vis("Show difference between each bar"),_Tr_Vis("Mode set to 'daily' can be used instead of interval for timezone based daily data"),_Tr_Vis("Default visible window interval")],
      "optionsdata": [ , , , , , , , , [["1", _Tr_Vis("Day")],["7", _Tr_Vis("Week")],["30", _Tr_Vis("Month")],["365", _Tr_Vis("Year")]] ],
      "html":""
    },

    "timestoredaily":
    {
      "offsetx":0,"offsety":0,"width":400,"height":300,
      "menu":"Visualisations",
      "options":["feedid","units","initzoom"],
      "optionstype":["feedid","value","dropbox"],
      "optionsname":[_Tr_Vis("Feed"),_Tr_Vis("Units"),_Tr_Vis("Zoom")],
      "optionshint":[_Tr_Vis("Feed source"),_Tr_Vis("Units to show"),_Tr_Vis("Default visible window interval")],
      "optionsdata": [ , , [["1", _Tr_Vis("Day")],["7", _Tr_Vis("Week")],["30", _Tr_Vis("Month")],["365", _Tr_Vis("Year")]] ],
      "html":""
    },

    "zoom":
    {
      "offsetx":0,"offsety":0,"width":400,"height":300,
      "menu":"Visualisations",
      "options":["power","kwhd","currency","currency_after_val","pricekwh","delta"],
      "optionstype":["feedid","feedid","value","value","value","boolean"],
      "optionsname":[_Tr_Vis("Power"),_Tr_Vis("kwhd"),_Tr_Vis("Currency"),_Tr_Vis("Currency position"),_Tr_Vis("Kwh price"),_Tr_Vis("delta")],
      "optionshint":[_Tr_Vis("Power to show"),_Tr_Vis("kwhd source"),_Tr_Vis("Currency to show"),_Tr_Vis("0 = before value, 1 = after value"),_Tr_Vis("Set kwh price"),_Tr_Vis("Show difference between each bar")],
      "html":""
    },

    "simplezoom":
    {
      "offsetx":0,"offsety":0,"width":400,"height":300,
      "menu":"Visualisations",
      "options":["power","kwhd","delta"],
      "optionstype":["feedid","feedid","boolean"],
      "optionsname":[_Tr_Vis("Power"),_Tr_Vis("kwhd"),_Tr_Vis("delta")],
      "optionshint":[_Tr_Vis("Power to show"),_Tr_Vis("kwhd source"),_Tr_Vis("Show difference between each bar")],
      "html":""
    },

    "histgraph":
    {
      "offsetx":0,"offsety":0,"width":400,"height":300,
      "menu":"Visualisations",
      "options":["feedid"],
      "optionstype":["feedid"],
      "optionsname":[_Tr_Vis("Feed")],
      "optionshint":[_Tr_Vis("Feed source")],
      "html":""
    },

    "threshold":
    {
      "offsetx":0,"offsety":0,"width":400,"height":300,
      "menu":"Visualisations",
      "options":["feedid","thresholdA","thresholdB","initzoom"],
      "optionstype":["feedid","value","value","dropbox"],
      "optionsname":[_Tr_Vis("Feed"),_Tr_Vis("Threshold A"),_Tr_Vis("Threshold B"),_Tr_Vis("Zoom")],
      "optionshint":[_Tr_Vis("Feed source"),_Tr_Vis("Threshold A used"),_Tr_Vis("Threshold B used"),_Tr_Vis("Default visible window interval")],
      "optionsdata": [ , , , [["1", _Tr_Vis("Day")],["7", _Tr_Vis("Week")],["30", _Tr_Vis("Month")],["365", _Tr_Vis("Year")]] ],
      "html":""
    },

    "orderthreshold":
    {
      "offsetx":0,"offsety":0,"width":400,"height":300,
      "menu":"Visualisations",
      "options":["feedid","power","thresholdA","thresholdB"],
      "optionstype":["feedid","feedid","value","value"],
      "optionsname":[_Tr_Vis("Feed"),_Tr_Vis("Power"),_Tr_Vis("Threshold A"),_Tr_Vis("Threshold B")],
      "optionshint":[_Tr_Vis("Feed source"),_Tr_Vis("Power"),_Tr_Vis("Threshold A used"),_Tr_Vis("Threshold B used")],
      "html":""
    },

    "orderbars":
    {
      "offsetx":0,"offsety":0,"width":400,"height":300,
      "menu":"Visualisations",
      "options":["feedid","delta"],
      "optionstype":["feedid","boolean"],
      "optionsname":[_Tr_Vis("Feed"),_Tr_Vis("delta")],
      "optionshint":[_Tr_Vis("Feed source"),_Tr_Vis("Show difference between each bar")],
      "html":""
    },

    "stacked":
    {
      "offsetx":0,"offsety":0,"width":400,"height":300,
      "menu":"Visualisations",
      "options":["bottom","top","colourt","colourb","delta"],
      "optionstype":["feedid","feedid","colour_picker","colour_picker","boolean"],
      "optionsname":[_Tr_Vis("Bottom"),_Tr_Vis("Top"),_Tr_Vis("Top colour"),_Tr_Vis("Bottom colour"),_Tr_Vis("delta")],
      "optionshint":[_Tr_Vis("Bottom feed value"),_Tr_Vis("Top feed value"),_Tr_Vis("Top colour"),_Tr_Vis("Bottom colour"),_Tr_Vis("Show difference between each bar")],
      "html":""
    },

    "stackedsolar":
    {
      "offsetx":0,"offsety":0,"width":400,"height":300,
      "menu":"Visualisations",
      "options":["solar","consumption","delta"],
      "optionstype":["feedid","feedid","boolean"],
      "optionsname":[_Tr_Vis("Solar"),_Tr_Vis("Consumption"),_Tr_Vis("delta")],
      "optionshint":[_Tr_Vis("Solar feed value"),_Tr_Vis("Consumption feed value"),_Tr_Vis("Show difference between each bar")],
      "html":""
    },

    "smoothie":
    {
      "offsetx":0,"offsety":0,"width":400,"height":300,
      "menu":"Visualisations",
      "options":["feedid","ufac"],
      "optionstype":["feedid","value"],
      "optionsname":[_Tr_Vis("Feed"),_Tr_Vis("Ufac")],
      "optionshint":[_Tr_Vis("Feed source"),_Tr_Vis("Ufac value")],
      "html":""
    },

    "multigraph":
    {
      "offsetx":0,"offsety":0,"width":400,"height":300,
      "menu":"Visualisations",
      "options":["mid"],
      "optionstype":["dropbox"],
      "optionsname":[_Tr_Vis("Multigraph")],
      "optionshint":[_Tr_Vis("Managed on Visualization module")],
      "optionsdata":[multigraphsDropBoxOptions], // Gets multigraphs from vis_widget.php multigraphsDropBoxOptions variable
      "html":""
    },

    "timecompare":
    {
      "offsetx":0,"offsety":0,"width":400,"height":300,
      "menu":"Visualisations",
      "options":["feedid","fill","depth","npoints","initzoom"],
      "optionstype":["feedid","value","value","value","dropbox"],
      "optionsname":[_Tr_Vis("Feed"),_Tr_Vis("Fill"),_Tr_Vis("Depth"),_Tr_Vis("Data points"),_Tr_Vis("Zoom")],
      "optionshint":[_Tr_Vis("Feed source"),_Tr_Vis("Fill under line"),_Tr_Vis("Number of lines"),_Tr_Vis("Default: 800"),_Tr_Vis("Default visible window interval")],
      "optionsdata": [ , , , , [["8", "8 " + _Tr_Vis("Hours")],["24", _Tr_Vis("Day")],["168", _Tr_Vis("Week")],["672", _Tr_Vis("Month")],["8760", _Tr_Vis("Year")]] ],
      "html":""
    }
  }

  return widgets;
}

function vis_init(){
  vis_draw();
}

function vis_draw(){
  var vislist = vis_widgetlist();

  var visclasslist = '';
  for (z in vislist) { visclasslist += '.'+z+','; }
  visclasslist = visclasslist.slice(0, -1);

  $(visclasslist).each(function(){
    var id = $(this).attr("id");
    var feed = $(this).attr("feed") || 0;
    var width = $(this).width();
    var height = $(this).height();

    var apikey_string = "";
    if (apikey) apikey_string = "&apikey="+apikey;

    if (!$(this).html() || reloadiframe==id || reloadiframe==-1 || apikey){
        var attrstring = "";
        var target = $(this).get(0);
        var l = target.attributes.length;
        for (var i=0; i<l; i++){
          var attr = target.attributes[i].name;
          if (attr!="id" && attr!="class" && attr!="style"){
            attrstring += "&"+attr+"="+target.attributes[i].value;
          }
        }
        pathfix=path.substr(path.indexOf('://')+3); // remove protocol
        pathfix=pathfix.substr(pathfix.indexOf('/')); // remove hostname
        $(this).html('<iframe frameborder="0" scrolling="no" marginheight="0" marginwidth="0" src="'+pathfix+'vis/'+$(this).attr("class")+'?embed=1'+attrstring+apikey_string+'"></iframe>');
        console.log('--> new relative url for iframe of '+ $(this).attr("class") + ': '+pathfix+'vis/'+$(this).attr("class")+'?embed=1'+attrstring+apikey_string);
    }

    var iframe = $(this).children('iframe');
    iframe.width(width);
    iframe.height(height);

  });
  reloadiframe = 0;
}

function vis_slowupdate() {}

function vis_fastupdate() {}