I saw that there were a few other forum post about this, but with no solution:
I was wondering: is it possible to show a text saying kWh used today (of this month / this year) for a specific feed without creating a kWh/d feed?
I have been using this scheme using virtual feeds which has worked well for me over the past 12 months.
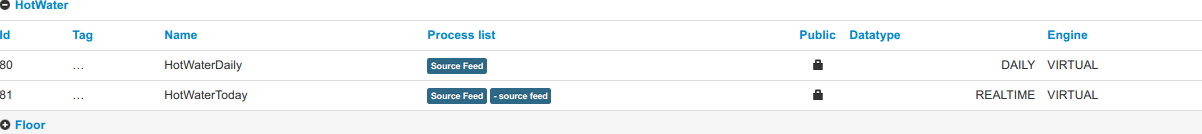
id Tag Name Process List Engine
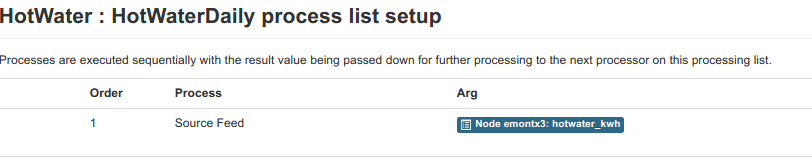
80 HotWaterDaily Source Feed DAILY VIRTUAL
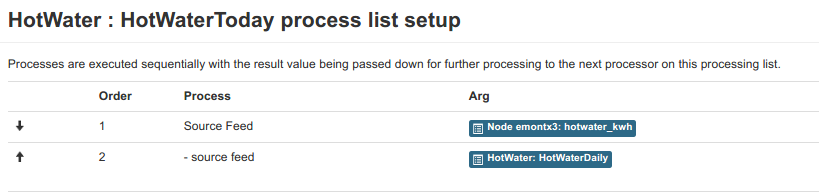
81 HotWaterToday Source Feed -SourceFeed REALTIME VIRTUAL
80 Source feed is hotwater_kwh produced from Power To Kwh forced Daily for Virtual Flow
81 Source Feed is hotwater_kwh again
and - Source Feed is 80 ie HotWaterDaily
However I am just in the process of adding kwh/d to my system because after 18mths of results my dashboard graphs (the ones that allow summarising kwh by day , by month or year … which is very nice  ) have become very slow … indeed causing the website to appear frozen for several minutes (which is not so nice
  ). I am hoping that basing them on kwh/d will make that go away … and I will no longer need these virtual feeds. Note it is not the virtual feeds that are the performance problem … they are not even used in the affected dashboards.
Garry - Can you add a screen shot of the virtual feed(s)?
Click on the Spanner/Wrench and the screen is titled: Virtual : NAME process list setup
Hi Jon,
There are two virtual flows. The first returns the daily portion a realtime
kwh flow ie the total up to the start of today.
The second is the net of the the original realtime flow and the above daily
virtual flow
ie total up to now minus the total up to the start of today … which
is consumption (or in case of solar … production) for today
I have used this setup for each kwh flow that I want todays consumption( or
production ) for.
However as mentioned I am investigating replacing this (and the use of the
delta approach in the graphs) by using the kwh/d process. The kwh/d
process is giving me the same numbers and I was hoping it would solve a
performance problem I have started to experience when clicking on the /M
button to analyse results by month. The website started becoming
unresponsive for several minutes.This has got progressively worse to the
point that I actually thought it had “frozen” permanently recently and
reset the emonpi. I am however a little worried that I am heading in the
wrong direction as whilst trawling the community database for information
on the use of the kwh/d approach I got the impression that it was not
favoured and may actually be deprecated?
Cheers
Garry
I don’t believe this is true, maybe Glyn @glyn.hudson or Trystan @TrystanLea can answer.
The kWh/d process should give you better performance than a virtual feed. I think the virtual feeds are calculated on the fly.
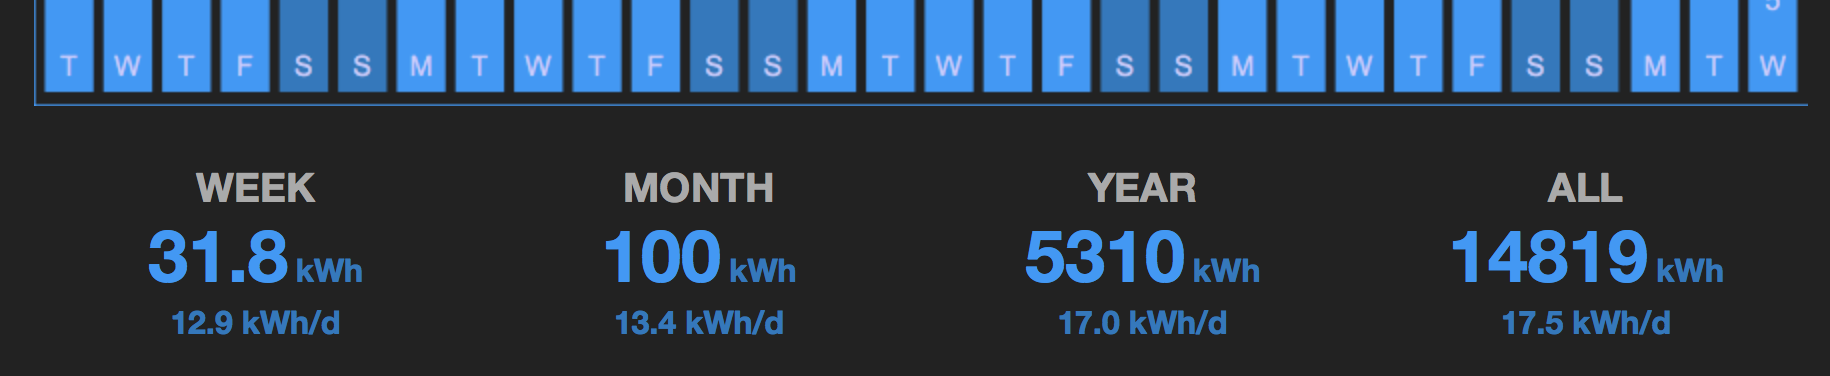
EDIT: I am guessing that info is available somehow somewhere. The My Electric app grabs the similar info (though these numbers maybe averages):
Sadly it is true, some years ago it was decided that power to kwh/d feeds were not needed as the “daily” feed API argument passed to a regular accumulator would use the delta from datapoints spaced 24hrs apart and the intention was to make maintaining a separate feed for daily totals no longer required, saving considerable disk space.
However, since then there has been no progress on how to display a feed widget that tells us the total so far today. Therefore we are now maintaining kwh/d feeds that stretch back to the first day of monitoring. just so we can display the running total for use today.
The MyElectric app uses just 2 feeds (use and use_kwh), The “Today” kWh value at the top right is derived from the delta between the datapoint closest to 00:00 today and the last value recorded, but this isn’t yet possible in emoncms dashboards so kwh/d is still with us.
The weekly and monthly values are calculated within the MyElectric app too, so it’s a similar situation where the emoncms main core doesn’t yet have this ability.
There was some discussions about new api’s for this purpose a long time ago but it didn’t progress far (see the Incrementing feeds - daily, monthly, yearly values? thread).
I’m not sure what this is… I don’t see an API for Daily
Yes I do remember this thread. it seemed like a nice way to move forward.
when using the usual feed api’s you can use the “Daily” argument rather than an interval eg
See the API docs on emoncms.org they seem to document it better than the main repo eg the description for the above api call is
“Returns feed datapoints at the start of each day aligned to user timezone set in the user profile. This is used by the bar graph and apps module to generate kWh per day from cumulative kWh data.”
[edit] alas it apparently only works on phpfina
although it does apparently work for daily. weekly and monthly data
I continue to use the kWh/d feeds because I need the daily running total on my dashboards, since I have them, I have no reason to use these API’s, (plus I use predominantly phptimeseries so the current status doesn’t work for me). I therefore have no experience of using these, I just know the’re there and why.
[edit 2]
Also if you use the graphs module and select daily weekly or monthly (below the graph) and reload you should see the url/api call change accordingly (if using phpfina I guess)
Hi Jon,
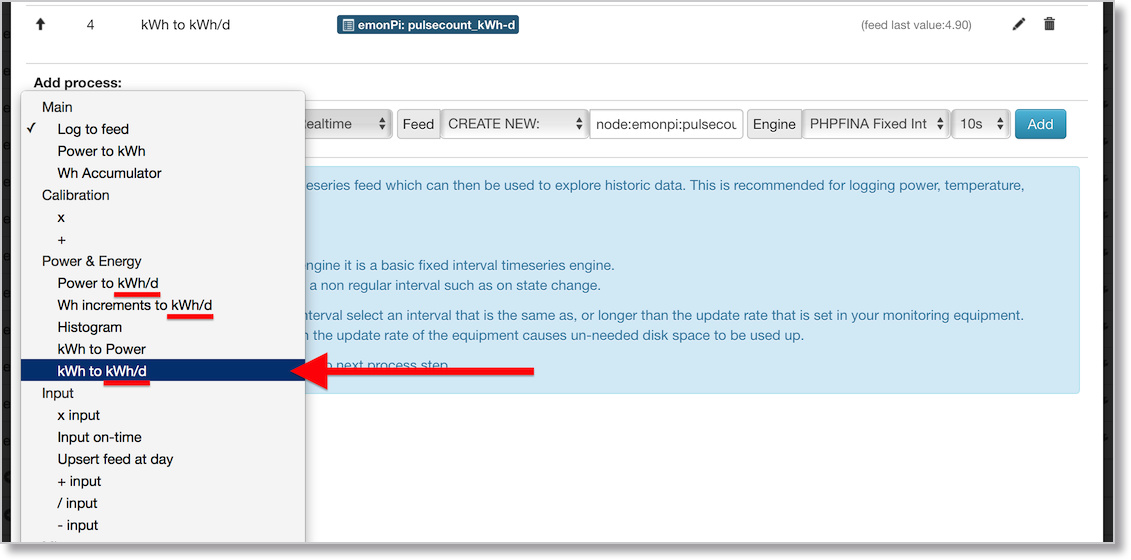
Thank you for that info. I am still producing the feeds by the “power to
kwh” as well as the “power to kwh/d” so at present I have both approaches
covered! I take your point about the virtual feeds potentially being a
performance problem but I am sorry I seem to have managed to confuse.
I do not believe the performance problem … and virtual feeds are related
as they do not appear within the same dashboard.
The performance problem:
My addition of the power to kwh/d into the input processing was to
attempt to solve a performance problem with several dashboards that contain
ONLY bar charts each with a source feed generated by the power to kwh
process. NO Virtual feeds involved! They all use the delta flag to extract
daily data from the feeds. The performance problem happens when you try to
use the /M button to get the data summarised monthly . This has developed
recently as the volume of data has increased over time I believe. It is
here I hoped that the feeds using “power to kwh/d” would work better for me
since if I understand it correctly a whole years data for a single feed is
held in a mere 365 rows compared with the “power to kwh” feeds which I
believe will have many more rows than that just for each days data.
The virtual feeds:
I have a single dashboard that presents the current state … power being
consumed from each CT input and kwh used so far today. The virtual feeds
were used to provide the kwh used today and do not appear to have any
performance problems. That dashboard appears to look and behave the same
irrespective of whether I use the virtual feed approach or the “power to
kwh/d” feed approach. Switching to using the “power to kwh/d” feed approach
in this context would more be just to get rid of a duplicate (and therefore
unnecessary) way of doing things given the presence of the kwh/d feeds.
Whew!
Hope that is clearer. I wouldn’t want to put any one off trying the
virtual feeds for fear of performance issues because for this case anyway
they appear to work just fine
Cheers
Garry
Hi.
Happy new year to all!
How can I use this to be “Published to MQTT”. The daily works, but what about monthly and yearly?
Thanks