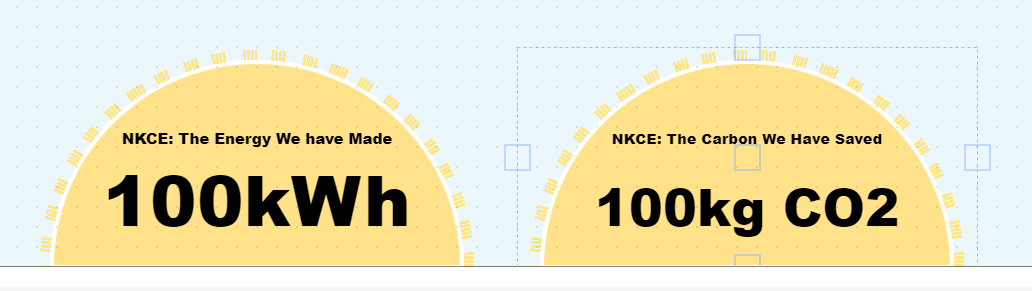
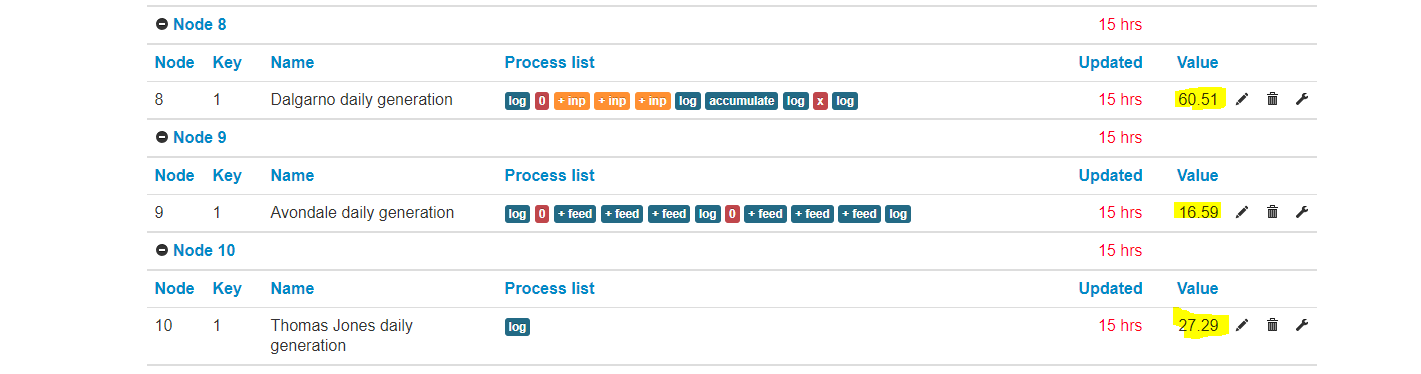
I have set up a new dashboard but the displayed values do not match the feed values they are linked to. As the values are identical, but the feed values are different, I assume some sort of limit is at work but I don’t know where the setting is.
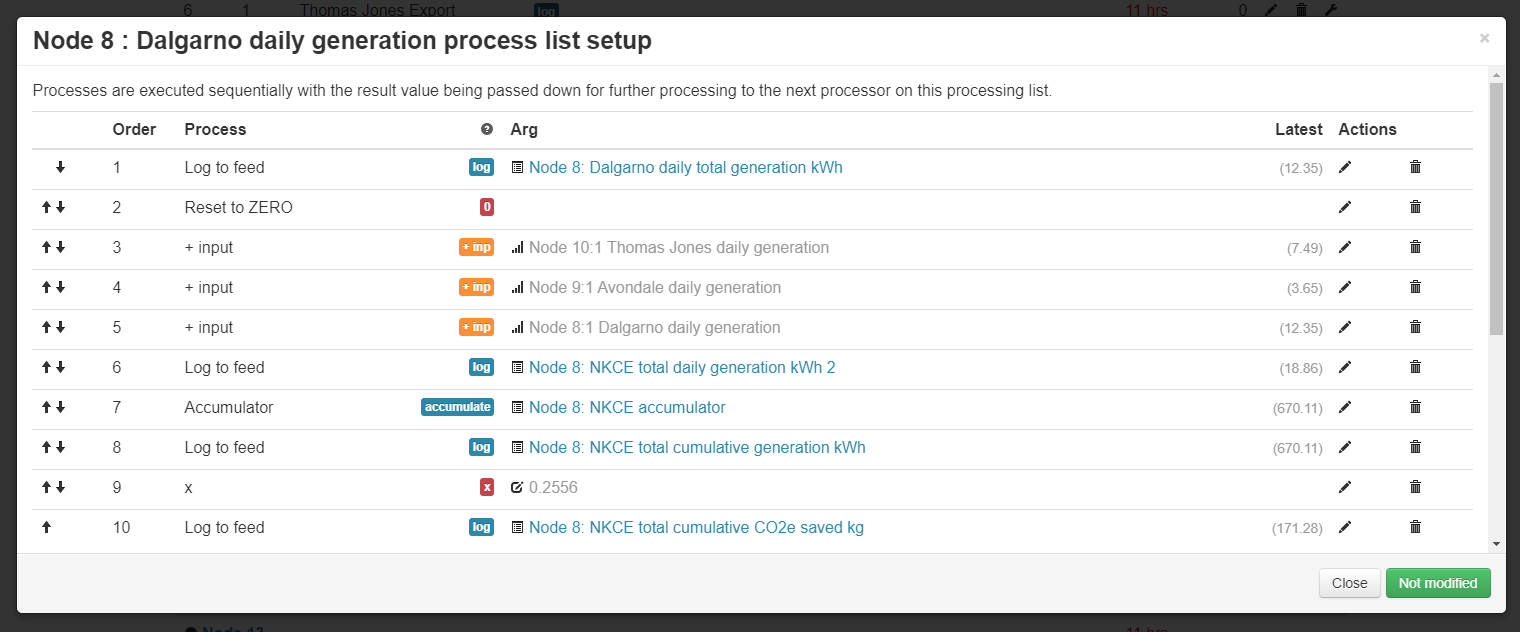
if the inputs are arriving in a sequence of input/post requests the order at which they arrive may explain what you are seeing… can you send the data in a single request under one node name perhaps? or do you know which one always arrives last?
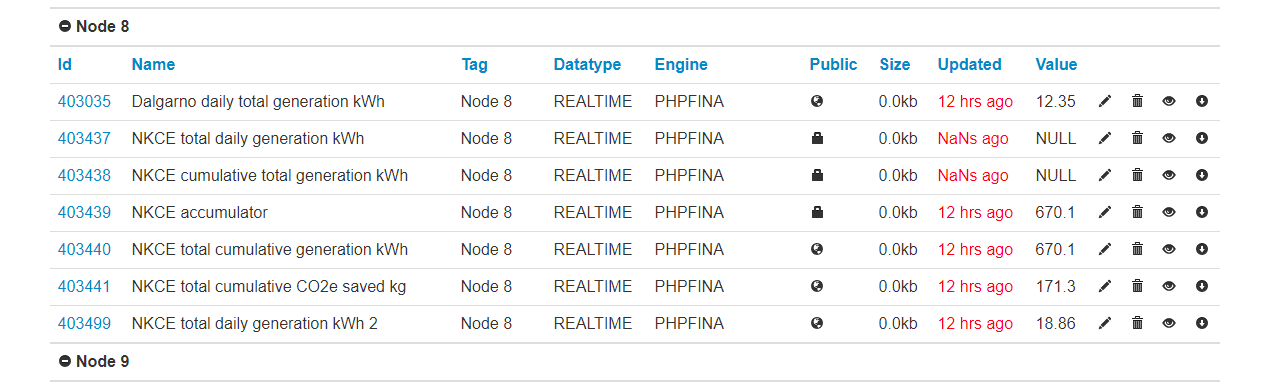
Thanks Trystan. I have responded on the other thread and will maybe leave this one for now, although there does seem to be a difference: When the input values are processed (+input etc) there are errors, which sounds like it could be due to the way the data is being sent to emoncms.org. However with the dashboard, the error is that the displayed values do not correspond to the values recorded under log to feed. As it is the feed value that is being passed on to the dashboard, I am confused as to why the timing issue on the inputs would affect the value displayed by the dashboard. There may be something I am missing but just to check!
As a test, we created a new input that sends a summed value of the three daily generation totals to Emoncms. This avoids the need for the calculation to be done within Emoncms, and therefore the errors that were being generated by the timing issue (this thread here: Error in calculation using +input function - #13 by Repower).
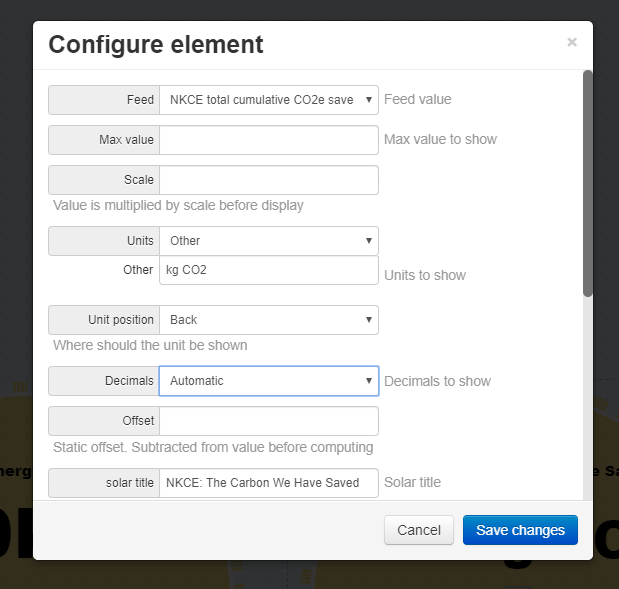
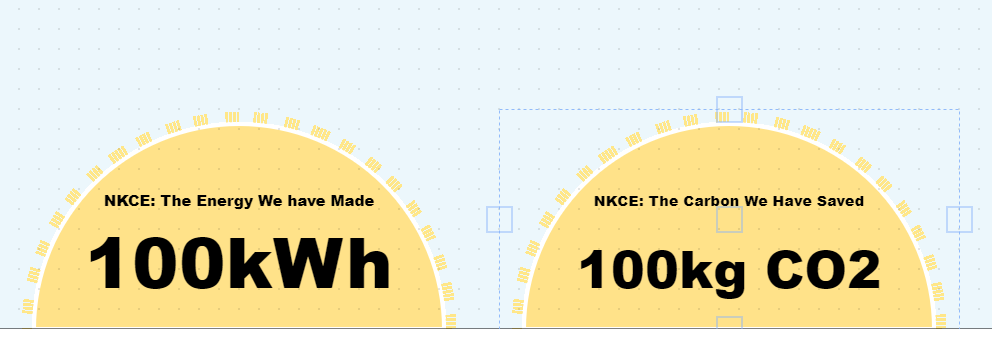
However, after changing the feeds for the dashboard, the figures displayed still do not match the feed value and are maxed out at 100.
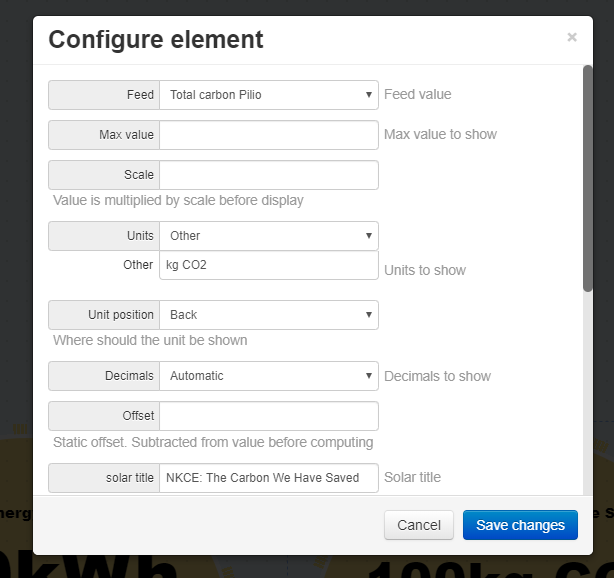
Sorry for the delay on this @Repower. It seems the default max value in those widgets is 100, I increased both to 1 million for you and the values are now showing correctly.