I’ve a “type 1” installation. Solar PV - Guide | OpenEnergyMonitor
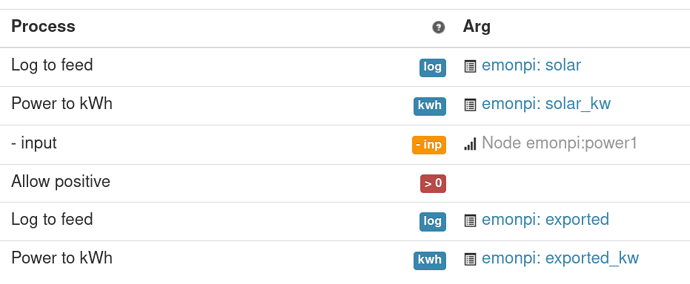
I’ve added these 2 feeds
-
exported energy to the grid
-
self consumption (virtual feed)
I now would like to create a graph where for each day I’ve
- produced kw
- self consumed energy
- imported from the grid
How can I do this ?

