Hi all
I am struggling to customise some of the graphics in emoncms and was wondering if there is a way to edit the graphics library (whether local server via emonbase or on emoncms.org).
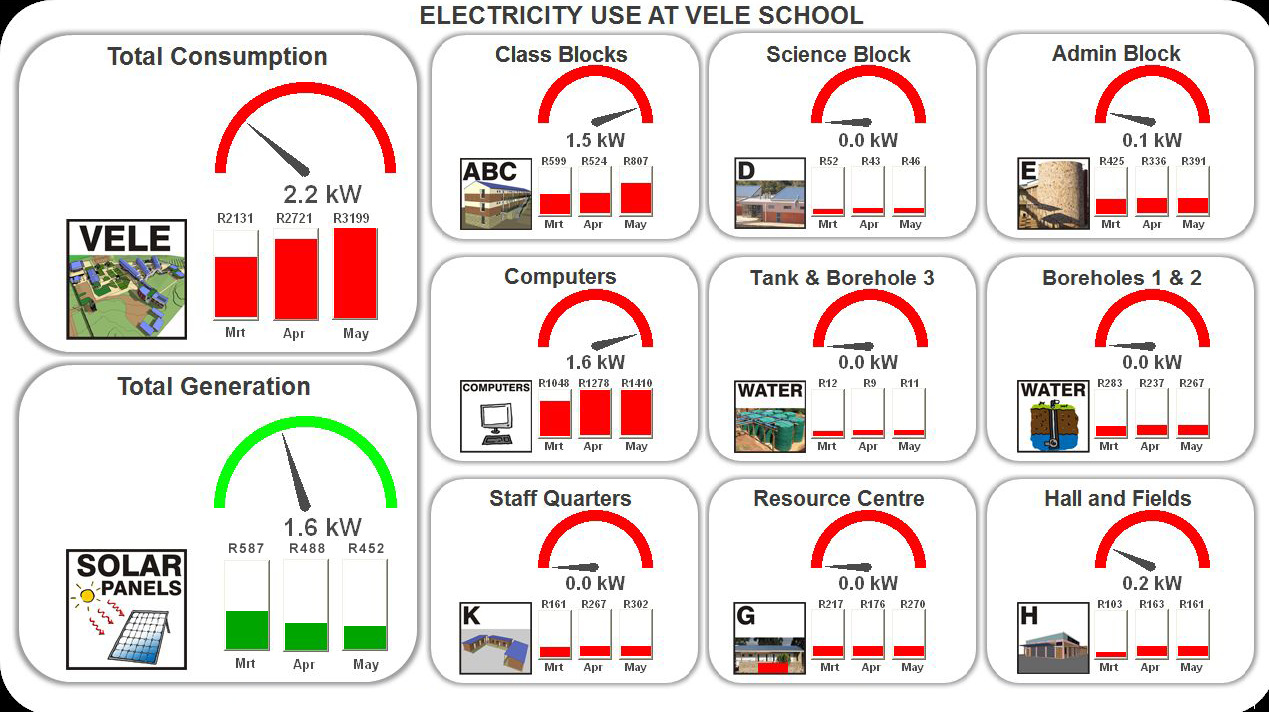
What I’m aiming for:
I am creating a dashboard for a school in rural South Africa. The school is divided into different sections, the image below should give a good indication.
What I’ve done:
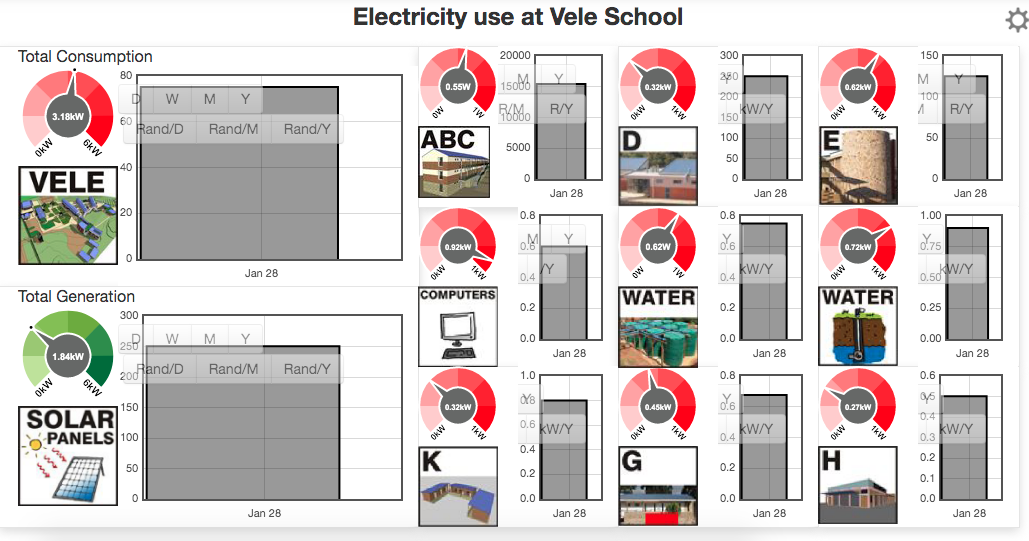
I have checked some of the videos creating dashboards and customising dashboards. I was able to achieve the following design on a local server (emonbase):
My questions:
- Can I edit the graphic libraries to show the dial as in the aimed design?
- Can I create a graph to show only the last three months of costs data?
Any feedback would be great.