Could anyone provide data about energy consumption or a house solar month production in a .csv file?
I need some data to make a research about it in a smart grid.
I can probably whip something up. Can you be more specific?
You said a month. What increment would you like the samples at (>= 10 seconds)
Would you like watts or kWh?
Which of these do you want?
Meter (net)
Usage
Solar Output
Hi Bob.
I want solar output and meter in W. If it is possible, I want the timestamp too.
Usually, what is the increment to these measure you have? The smallest metric you have is 10s?
Here you go: Two CSV files in dropbox
August 2017, 10sec intervals, two files - main and solar.
These are about 22mb each and I’d like to delete them as soon as you pick them up, so let me know when you have them.
Thank You so much Bob!
i picked them up ![]()
Just one more question, what is the SGBD you use?
Had to look that one up. I’m going with the french based acronym for data base management system (DBMS). I got that data from Emoncms, which is a service with a few different time-series database engines that is associated with this OpenEnergyMonitor project. I also use influxDB a bit.
Regards,
Bob
sorry for my error in acronym SGBD, I just forgot of translate it haha
So, how much time do you use this system?
Do you use in your house?
Hey bob.
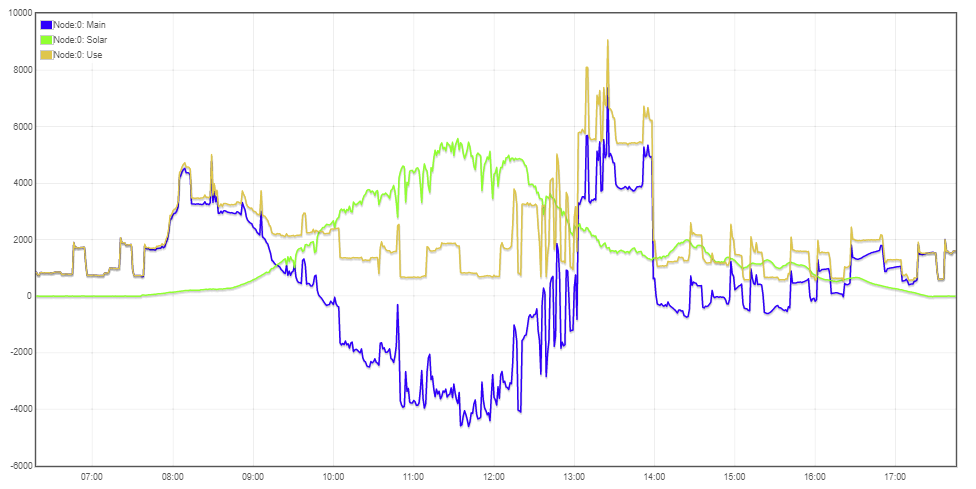
The main csv have so many negative values, what it can be?
Watts would not be positive values?