I’m currently playing with the Agile Octopus data, as I’m moving to it soon.
I’ve put together some Python to pull forward price data from the Octopus API and upload it to a EmonCMS instance. It works great, data appears and it’s all great apart from one small niggle.
Even though the time data is on the hour and half hour, the times when I hover over the graph are out. I.e. the data for 12:30 is logged at 12:32, for 13:00 at 13:02, etc.
The time offset is consistent but there does not seem to any pattern to it. Rerunning the upload (overwriting the data) causes the offset to alter.
I’ve tried adjusting the sentat parameter and the times are on the hour/half hour, but no dice.
Regards the “supplementary question”, that is just where the times/intervals used in the graphing query are independent of the data being queried. If you look at the values used in the graphs query directly below the graph, they can be altered to almost any interval and start/end times you like (within the size/pixel restrictions of the graph area) so you could change the start time to a multiple of 1800 and the interval to 1800 and get the graph you expect.
With regard to having absolute control of the recorded timestamps, there are 2 main element to this.
First, the only way to be sure of avoiding the timestamps you provide being “adjusted” is to use a “time=0” parameter in the bulk upload api (rather than sentat= or offset=). The other methods use it’s own server time to “adjust” the supplied timestamps and can introduce errors if there is any network delays or differences in the times between the 2 devices.
This is discussed in the Best way to guarantee times when using BULK load with PHPTIMESERIES? - #2 by pb66 thread and other forum discussions can be found by searching “data=0”. Unfortunately most of the links I made in that discussion are no longer right as the code has been refactored and moved to emoncms/Modules/input/input_methods.php but still works the same way.
The next part is once you have reliable “absolute” timestamps being used in the input stages, you need those datapoints to be saved to the right time slot in a fixed-interval feed. The slots all start at multiples of the interval from the start time. Therefore if your feed is 60s and commissioned at 10s past the top of the minute, every slot will start at 10s past the top of the minute. So if you data is presented with an absolute timestamp that happens to be 7s past the top of the minute, it will be 3s short of being out in the next slot and placed in the previous slot, effectively removing 57secs from the timestamp as the slot position relative to the feed start time IS the timestamp from here on.
Luckily, this latter point is easily managed if you sort the absolute timestamps in the requests before creating the new feeds because regardless of when you actually create the feeds, the start time is the timestamp of the first saved data. Unfortunately it is not possible to change the start time once a feed is first used.
Where are the timestamps originating from? are they read from the Agile website or are you just querying that site every 18000 secs? Are the 1800s intervals anchored in time somehow or just “every 1800s”?
Hi Paul,
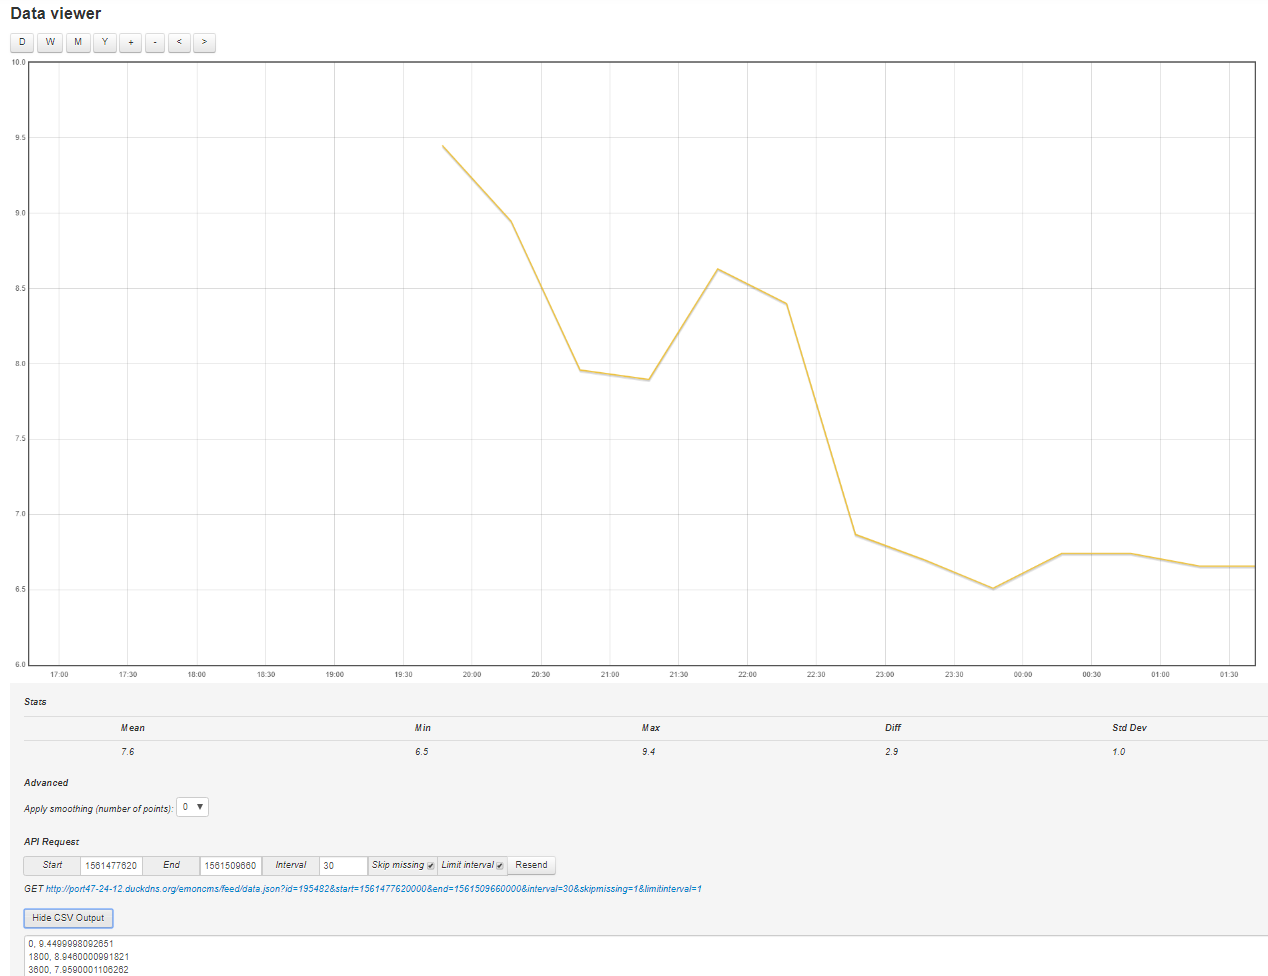
The time=0 didn’t seem to make much difference. I deleted the feed and set the imput up again. As you can see from the graph below the datapoints do not sit on the right times.
So I’ve set the start date/time (converted to epoch) as the time that ‘reading’ of the price is taken. Debug output from the program for those two datapoints below -
As i explained in connection with your second post above. The graphing is independent of the collection and storage of the data. Even when you know you have precisely the right data in the feeds, if you call a graph “out of sync” with those 1/2 hourly data points you will get unexpected results.
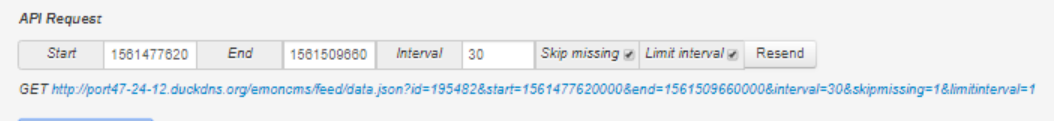
Look at you graph request data directly below the plot.
if you convert those values to the number of equivalent 1/2hourly periods
start time 1551477820 = 861932.1222222222 1/2hrs
end time 1551509660 = 861949.8111111111 1/2hrs
[therefore total time 31840 = 17.68888888888889 1/2hrs]
and interval 30 = 0.0166666666666667 1/2hrs
Nothing is a multiple of 1800 so what you are seeing is the period between the start and end time, divided into 30s intervals and the nearest datapoint found to each of those 30s intervals is displayed where possible.
Retry the graph after editing the values to 1551477600 and 1551508200 with an interval of 1800 and see what that looks like.
If that’s not right then check that your feed start time is a multiple of 1800 using the https://emoncms.org/feed/getmeta.json?id=1 api where id=1 is the feed id in question.
TBH looking at the graph, to me it does suggest the issue is with the feed start time, assuming the feed is actually a 30min fixed interval and not a 30s fixed interval, but that api call will confirm both the start time and the interval, from that you can determine what each datapoints timestamp will be, start time plus a multiple of interval. That part cannot change, if the input times vary they will be “adjusted to fit” and if the query timestamps are different, the nearest datapoint will be returned. The data itself will always be stored at feed start time plus a multiple of fixed-interval.
You are of course correct. With “time=0” that data is stored correctly, it’s just he views in the graph that are off depending on how you view it. Picking the “view” icon from the Feed screen, and then adjusting the graph to start on the hour puts all the datapoints correctly onto the hour/half-hour. Perfect!
Just one last question, how is the issue of GMT/BST dealt with in relation to the stored dates?
EmonCMS stores everything with a UNIX timestamp - so UTC to all intents and purposes.
It is when you view that timestamp, any TimeZone is added.
Emoncms assumes all date/time, if it is associated with data input, as being UTC unless there is specific TZ information in a known format. Otherwise it uses the server Unix time.