not sure this is another bug but if it is, maybe time to start another thread next to this one
I made a graph with several feeds from 2 nodes, worked like a charm, logged in I can see the dashboard where I published it. But once logged out and knowing the url, no way to see it, going to the login page
All feeds are public and dashboard is public and published …
here is a link to the page (id 3 and 6 are ok)
also nav bar shows twice … same on Safari, FF and Opera on my mac.
just installed this module and indeed it is a GREAT improvement to setup graphs …
Only thing is that the color choosing thing isn’t working for me in Safari.I just get empty white boxes instead the color and clicking in it doesn’t do a thing.
am on Os X Yosemite and Safari 9.1.2, with Firefox 48 it is ok (and upped to 49b7 is also working) and Opera is ok.
Can’t find any reason for now.
Eric - when using Safari the Color blank box gets filled in with a six digit hex code. 2A6D9E will give you a nice steel blue color. 000000 is black and FFFFFF is white. In the Mac App store there are lots of Color Picker type apps - look for one that outputs a hex color code. I use this one: Color Picker on the Mac App Store. This is in the US Mac App Store.
I know how it works with hex colours but why would Safari not propose the color options when FF and Opera do on the same machine ? Somehow the code used is not recognised or blocked by Safari … not everyone is at ease with these #codes like me with node-red
upgraded to latest 9.7.2 isn’t solving it
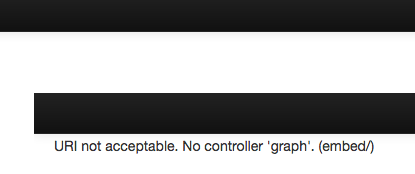
de-activatd the module (via ftp I can just rename the directory = same result as deleting)
but with an error since the module can’t generate the image
deactivating the vis directory doesn’t solve it neither (except the other graphs are dead)
had a look serverside in the logs and none is generated related to this. Server is Centos/cpanel …
not sure how to debug this …
No not really! that’s then a graph module with a different name, emoncms still see’s that module in it’s Modules folder and it can still have an effect on the system. You must move it or delete it, to be sure.
You may get the same result (and I suspect you probably will) then the issue lays elsewhere and it is definitely not the graph module if you still have issues with it deleted.
I just noticed I had your faulty page open in my browser, refreshed it and it is still the same.
I then went through each dash id from 1 to 15, 3 and 6 are publicly viewable, pages 1,2,4,5,7,8,10 and above all display the correct login page.
Only dash id 9 resolves to this double nav bar issue. there has to be an error on that dashboard, or an error in/on something you ONLY use on that dash and no other. try cloning that dash and see if the clone is an issue, if it is then start removing parts until it is no longer an issue and that will get you closer to the cause.
ok here we go with the continued debugging
know there were only 3 pages, 3-6-9
took out the module and went back to the page, same double nav bar
deleted the page and module still not installed : back to normal
added back the graph module and went to page 3-6 : all ok (remember page 9 is not existing anymore)
went to a random number = ok
added page 11 (empty) and it shows ok
added the graph back to page 11 = again double nav bar when not logged in
added page 12 empty = normal login
so now we have existing pages 3-6 with graphs from visu module
page 11 with a graph from graph module
page 12 empty …
conclusion so far, just adding the graph module doesn’t cause the problem
an empty page is ok
from the moment I add a graph made with graph module to a page, we get the double nav bar when not logged in
As far as I can tell you may have something quite unique there!
I have tried recreating your findings and cannot under any circumstances get a double navbar.
When discussing the graph module in the other thread I created a fresh page for the “cpu_temp” graph example and that presents a normal log screen when I am not logged in, so I think I have overshot my usefulness with this issue and you may have to seek some guidance from @TrystanLea.