Hello, I’m new to all this and really not sure if my questions have been covered previously (most likely), I just found it difficult to find information related to my particular situation.
I followed this - learn/how-to-build-an-arduino-energy-monitor-measuring-current-only.md at master · openenergymonitor/learn · GitHub
I will eventually monitor voltage as well but don’t have a transformer as yet.
I wanted to add another CT, I assumed I could use the existing voltage divider and just use another analogue input on the arduino for the next CT, but how would I modify the sketch to include another pin?
Hope this makes sense 
Regards Bryan
It’s not really sensible to share the voltage divider, because the two c.t’s will interact - only slightly but they will. But you can give it a go if you wish.
To add the second c.t. in the software, you need to create another instance of the class EnergyMonitor, thus:
EnergyMonitor emon1, emon2;
and then in setup() you need to tell it the input pin etc, so add:
emon2.current(3, 111.1); // whatever pin you choose
and add it in loop too:
double Irms2 = emon2.calcIrms(1480);
And finally, print the value - I’ll leave you to work that out  .
.
You might want to add a delay in loop so that it pauses for a few seconds between (pairs of) readings.
Thanks Robert, I began that process, ie create another instance and pin designation, but got down to the calc ( Serial.print(Irms*230.0) and noticed that it makes no reference to pin 1, so confusion set in at that point.
It sounds like I should also build a separate voltage divider too
Thanks again, made a few adjustments (and a few boo boos) for this result, Aircon is off at time of reading so just showing spurious noise I guess -
Total_Watts: 898.94 Total_Amps: 3.60 Aircon_Watts: 41.35 Aircon_Amps: 0.17
Total_Watts: 901.91 Total_Amps: 3.61 Aircon_Watts: 41.37 Aircon_Amps: 0.17
Total_Watts: 895.20 Total_Amps: 3.58 Aircon_Watts: 41.59 Aircon_Amps: 0.17
Total_Watts: 892.73 Total_Amps: 3.57 Aircon_Watts: 42.72 Aircon_Amps: 0.17
If you want the value if Irms2, that’s the one you must print.
What I told you to do was duplicate all the things concerning the first channel, but with different names. So adding emon2 in here EnergyMonitor emon1, emon2; duplicated emon1; adding the line Irms2 etc duplicated the line for Irms.
What happens behind the scenes is:
EnergyMonitor is a Class that does the reading and the calculations. You can have as many copies (“instances” is the correct term) of it as you like, they are all independent.
When you do Irms2 = emon2.calcIrms(1480);, you’re telling the emon2 copy to go away, measure the current connected to the pin you told it with emon2.current(3, 111.1);, and put the result into Irms2. Then you probably wanted to multiply by your voltage to get the power (not strictly true but good enough for now) Irms2 * 240 and print that.
EnergyMonitor has also got “postboxes” - variables where it puts the result of the calculations. You’ll meet those when you come on to measuring the voltage as well. (examples: emon1.Irms, emon2.realPower)
Hello Robert,
I finally made it to town and now have a voltage transformer to use
with the arduino.
I will have to experiment a little with calibration but seems reasonably
accurate so far.
My issue at the moment is the plotting of the data as it seems the plot
is "too busy" for the arduino plotter, I have included some screenshots
of the plots.
If I remove one CT from the sketch I have my familiar looking plot that
I would interpret as -
Red - apparent power
Blue - real power
Green - voltage
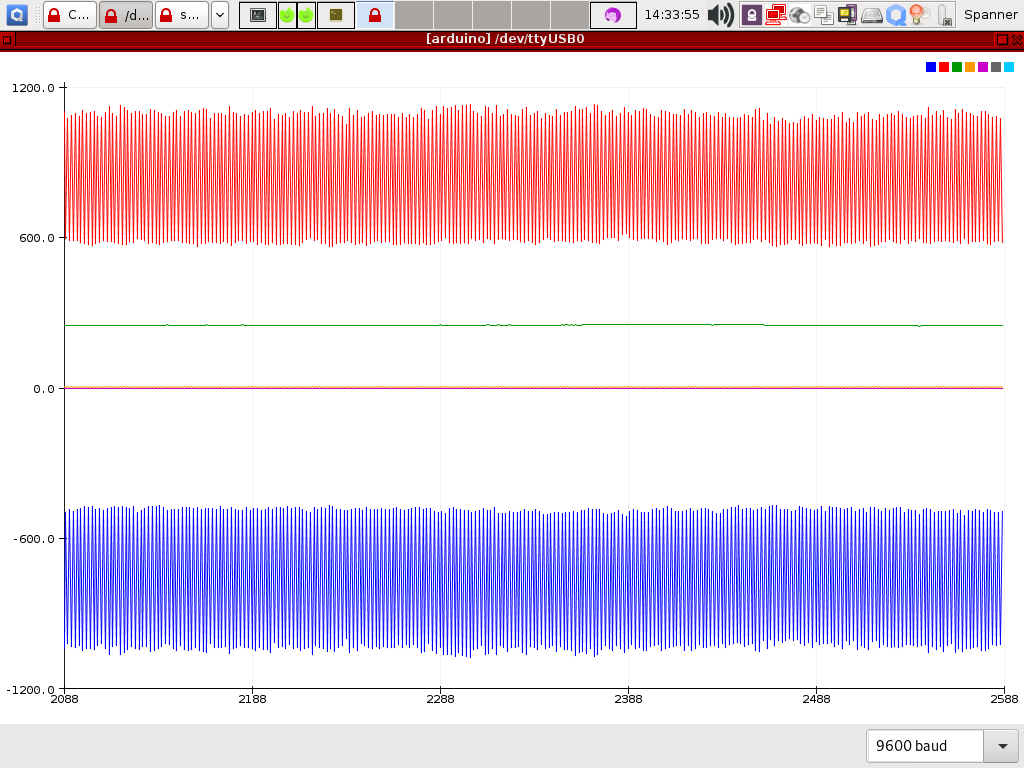
If I include the second CT, however, the plotted display is jumbled, or
more difficult to interpret.
I did reverse the volt signal wires to change sign as you can see in the
single plot, but in that config with both CT’s four traces are written
over each other making the situation worse still.
As the plotter function in the arduino software is not so configurable,
or so it seems, is there a better way to plot this information?
Regds
Bryan

I’ve never even tried that, so I can’t make any comment about it. I export the numbers into a spreadsheet, and use that - for short-term use, when I’m not using emonCMS.
Did you do this?
I think I can see what’s happening (1st screenshot). The plotter can’t distinguish between the numbers from the two c.t’s. I think you need to print both sets of numbers on the same line so that the Arduino IDE can distinguish them. This isn’t a fault with emonLib or with what you’re doing, only in the way you are passing the data out to the plotter.
If that doesn’t separate the traces adequately (I presume they will acquire different colours), you could always add a constant offset (but then don’t forget and misread the graph!)
Thanks Robert,
You may have guessed I don’t really know what I’m doing with all this
but having fun and learning a little along the way
A delay didn’t seem to make any difference, I also found the Emonlib.cpp
file and changed the Serial.println to Serial.print to print all output
on the one line, however, I found that a plot was not generated at all.
The EmonCMS seems complex for me and my non-standard setup for now at
least, my solar installation is on another building so it won’t show me
locally consumed power as that is on a different spur line.
So I have a data cable to the solar install and can read total solar
production from there and read my consumption from the arduino on the house.
I’ll look into exporting to spreadsheet, can you recommend a guide for such?
It should have done - at the least, it will reduce the number of data points you get - do you really want one every half-second or so (which is what you’ll get with two calls to calcVI( ) and no other delay - apart from printing - in the loop).
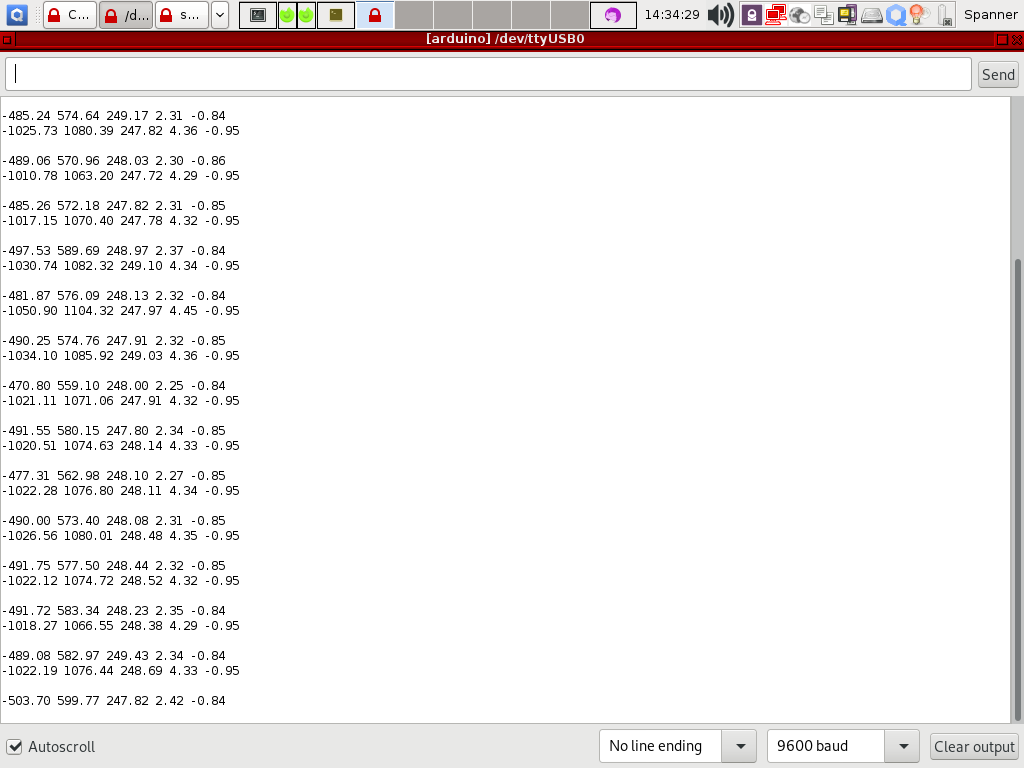
No, you shouldn’t have changed emonLib. What you needed to do is write your own Serial.print in your sketch, something like (if you don’t want the names, just the numbers, printing):
Serial.print(emon1.realPower); Serial.print(" ");
Serial.print(emon1.apparentPower); Serial.print(" ");
Serial.print(emon1.Vrms); Serial.print(" ");
Serial.print(emon1.Irms); Serial.print(" ");
Serial.print(emon1.powerFactor); Serial.print(" ");
Serial.print(emon2.realPower); Serial.print(" ");
Serial.print(emon2.apparentPower); Serial.print(" ");
Serial.print(emon2.Vrms); Serial.print(" ");
Serial.print(emon2.Irms); Serial.print(" ");
Serial.println(emon2.powerFactor);
And that will print a single line something like
485.24 547.64 249.17 2.31 0.84 1025.73 1080.39 247.82 4.36 0.95
489.06 570.96 ...[etc]
No - I just copy and paste!
LibreOffice can (with a tiny bit of setting up) take data that you copied from the Arduino IDE Monitor and put it into a spreadsheet.
As I mentioned, I use that only for short-term recording. The problem with that of course is you need to keep a window open on your computer (else the data gets lost - your Arduino won’t be storing anything unless you’ve done something different) and you need to manually transfer the data. I’ve no idea when the Arduino monitor will fill up, but I can believe it will, so it’s not something you can leave unattended for too long.
To do it without manual intervention requires another computer running a database to store the data as it arrives, and some software to display it. Our choice for the computer is a Raspberry Pi, which you can connect serially (provided it and the Arduino aren’t too far apart). But you can use a discarded machine if you have one, provided it can run as a server.
Our choice for the database and display is of course our homegrown emonCMS. The big advantage is a lot of people round here know a lot about it.
If you don’t like emonCMS, InfluxDB and Grafana have been mentioned, but I know nothing about those. My colleague here @Bill.Thomson does I believe use Influx & Grafana. (Grafana is a proper graphing program, not a spreadsheet.)
[Robert.Wall] Robert.Wall
https://community.openenergymonitor.org/u/robert.wall Robert Wall
https://community.openenergymonitor.org/u/robert.wall
27 NovemberWhoroo: A delay didn’t seem to make any difference,It should have done - at the least, it will reduce the number of data points you
get - do you really want one every half-second or so (which is what you’ll get with
two calls to calcVI( ) and no other delay - apart from printing - in the loop).
Yes, it did reduce the data points, but didn’t change the plotting issue
 Whoroo:

 I also found the Emonlib.cpp
 file and changed the Serial.println to Serial.print to print all output
 on the one line, however, I found that a plot was not generated at all.
No, you shouldn’t have changed emonLib. What you needed to do is write your own
Serial.print in your sketch, something like (if you don’t want the names, just
the numbers, printing):Serial.print(emon1.realPower); Serial.print(" “);
Serial.print(emon1.apparentPower); Serial.print(” “); Serial.print(emon1.Vrms);
Serial.print(” “); Serial.print(emon1.Irms); Serial.print(” “);
Serial.print(emon1.powerFactor); Serial.print(” “);
Serial.print(emon2.realPower); Serial.print(” “);
Serial.print(emon2.apparentPower); Serial.print(” “); Serial.print(emon2.Vrms);
Serial.print(” “); Serial.print(emon2.Irms); Serial.print(” ");
Serial.println(emon2.powerFactor); |And that will print a single line something like
485.24 547.64 249.17 2.31 0.84 1025.73 1080.39 247.82 4.36 0.95|
489.06 570.96 …[etc]|
Ah, I saw emon1.serialprint(); and found a block of code in Emonlib.cpp
that looked like it was doing the job and made a change ( I reversed the
change when it proved to have no benefit ) there, it did all print on
one line, but the plotter just showed a blank screen, didn’t even render
a scale.
 Whoroo:

 I’ll look into exporting to spreadsheet, can you recommend a guide for such?
No - I just copy and paste!
LibreOffice can (with a tiny bit of setting up) take data that you copied from
the Arduino IDE Monitor and put it into a spreadsheet.As I mentioned, I use that only for short-term recording. The problem with that
of course is you need to keep a window open on your computer (else the data gets
lost - your Arduino won’t be storing anything unless you’ve done something
different) and you need to manually transfer the data. I’ve no idea when the
Arduino monitor will fill up, but I can believe it will, so it’s not something
you can leave unattended for too long.
For the moment I’m ok with just looking at the data as it arrives, been
interesting to see the habits of the place’s power consumption, other
than that for now I just balance the production against the consumption.
To do it without manual intervention requires another computer running a
database to store the data as it arrives, and some software to display it. Our
choice for the computer is a Raspberry Pi, which you can connect serially
(provided it and the Arduino aren’t too far apart). But you can use a discarded
machine if you have one, provided it can run as a server.
I have a raspberry pi, so I could look at utilizing it at some point