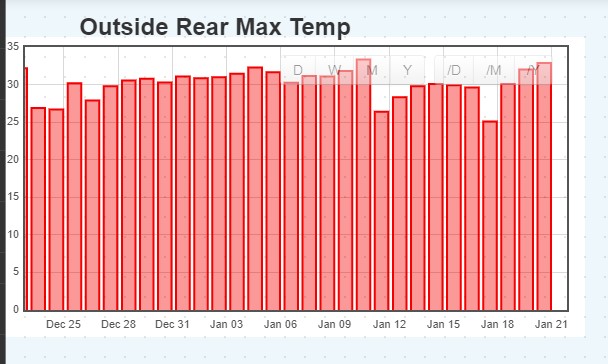
I have been using the standard bar graph built into the Dash Board, but I wanted to have it auto scale. There doesn’t seem to be an option for this. I then tried the dedicated graphing section. When displaying a line graph the graph auto scales correctly, however this is not the case with the Bar Graph Type.
Is this normal or am I missing something here?
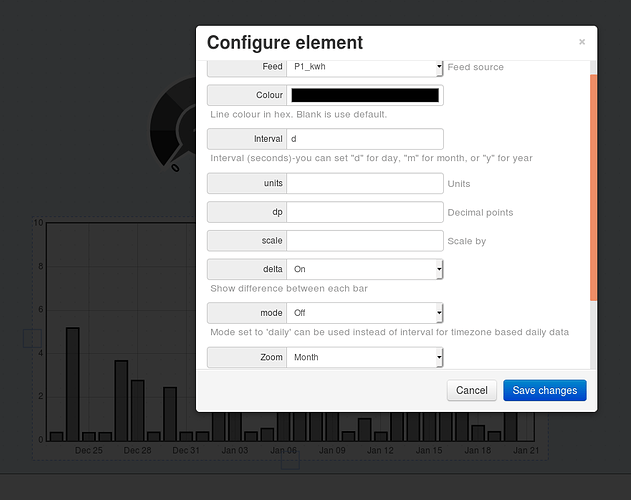
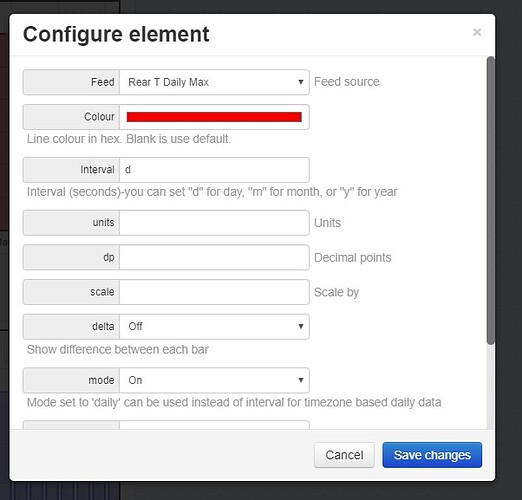
Hello @whatsupskip the bar graph should definitely autoscale, can you show a screenshot of what your seeing? Here’s my test just now:
Thank you for your help with this.

I just thought, may be I am not using the correct term about scaling. May be the term is off setting. I don’t want the graph to show all the way to zero.
Ah I see what you mean. Unfortunately this is not something we can change, its how its been implemented in the flot graphing library that we use.
Thank you for your reply. I understand.


