I’m interested in the average unit rate that homeowners are paying for their total electricity usage when they have a well-designed, installed and run ASHP system. I note that the electricity cost used in the spreadsheet is 29.5 p/kWh throughout. Is this the average from all installations in the list? If it is, is it just for the ASHP element, or is it an average purchase price for all the electricity purchased?

Thanks Chris - apologies for not replying sooner, I’ve been on a short holiday…….
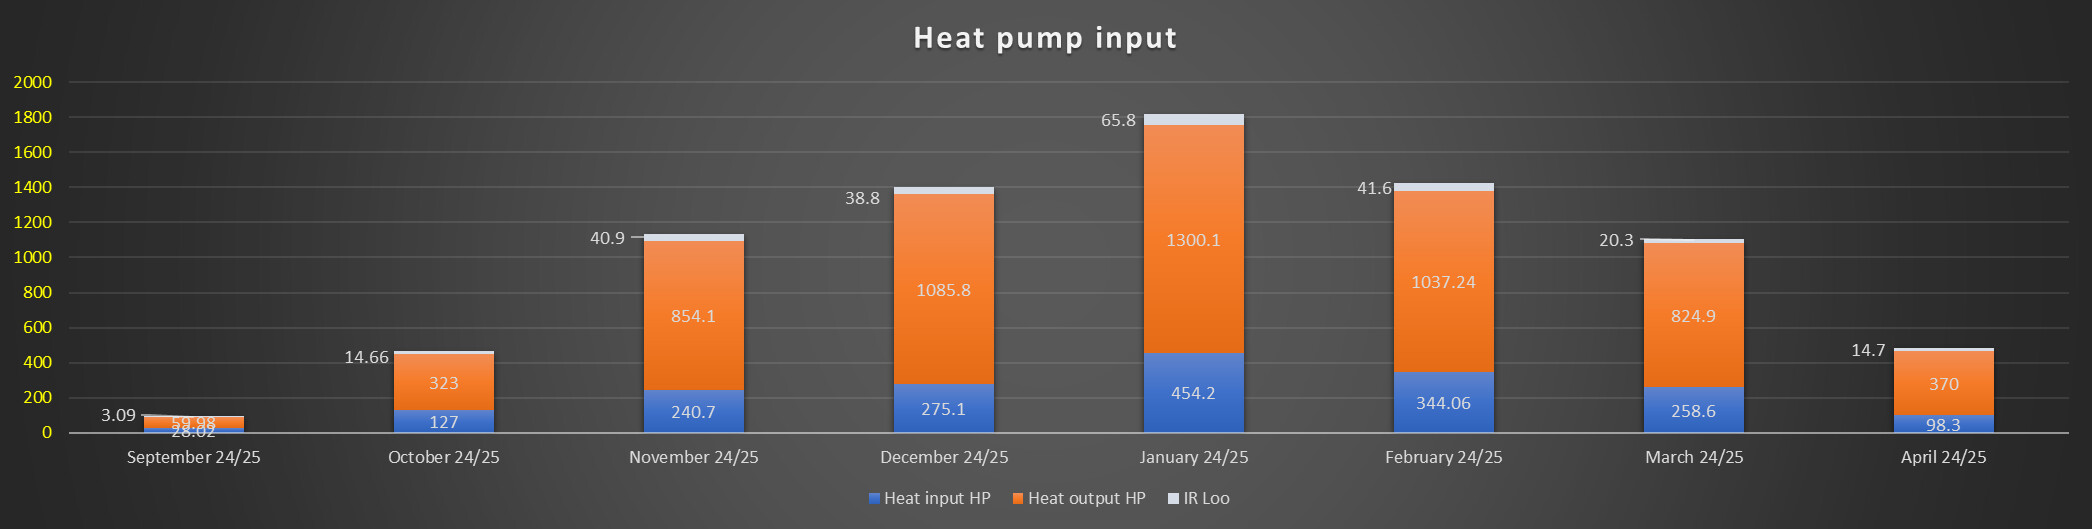
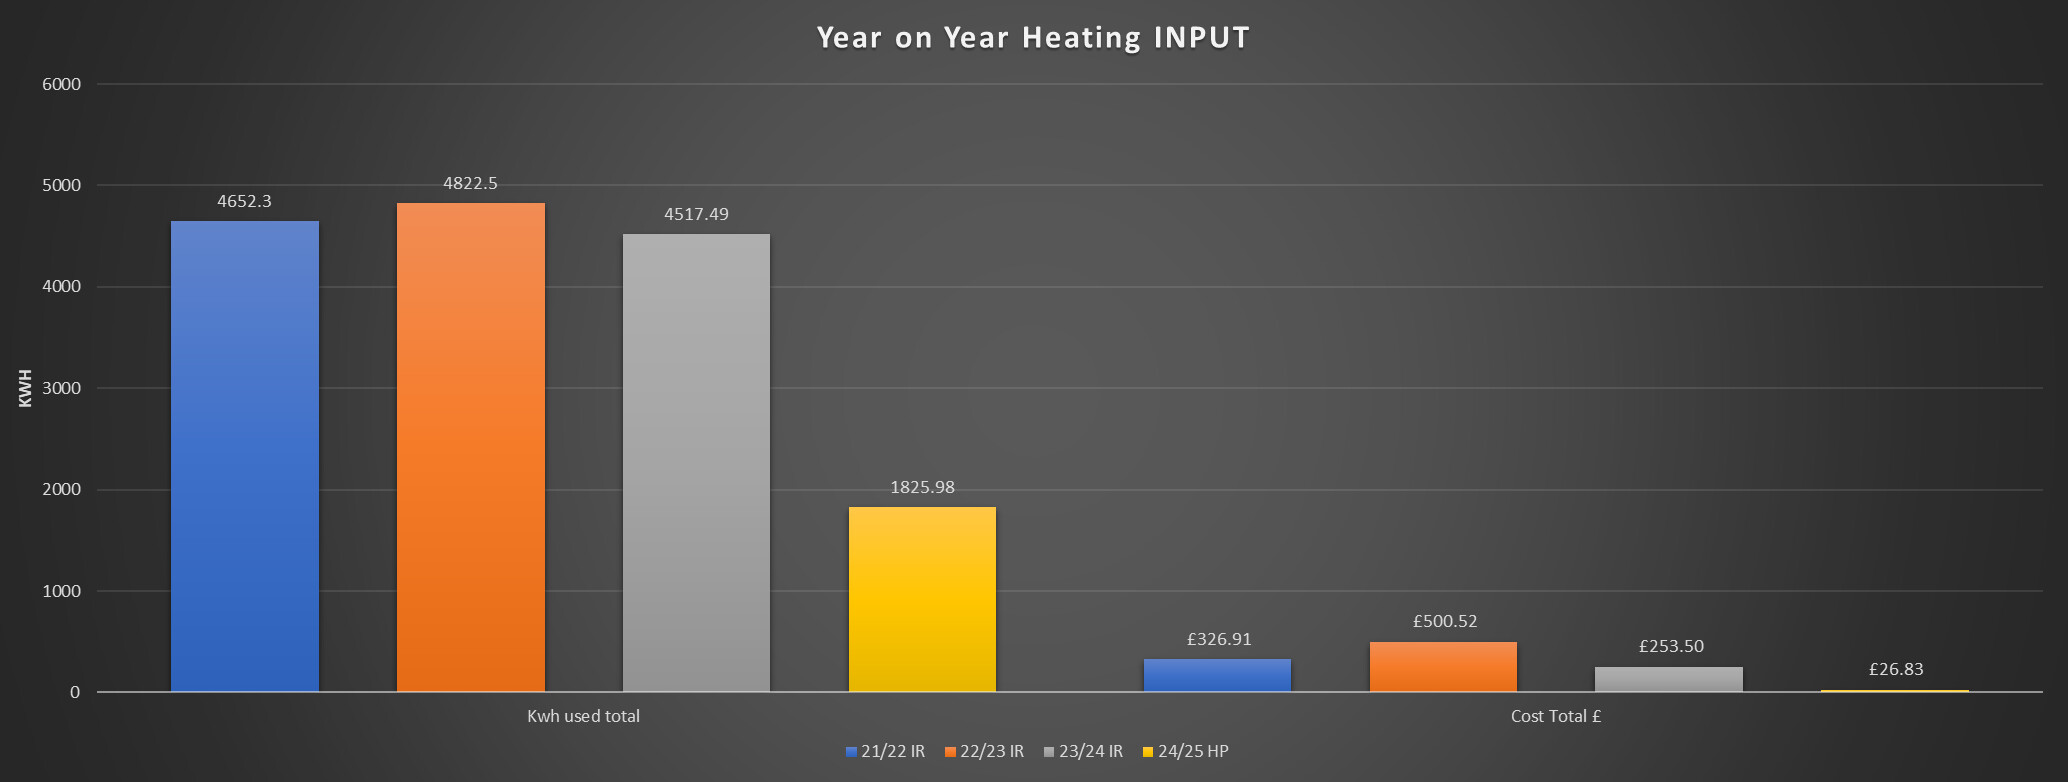
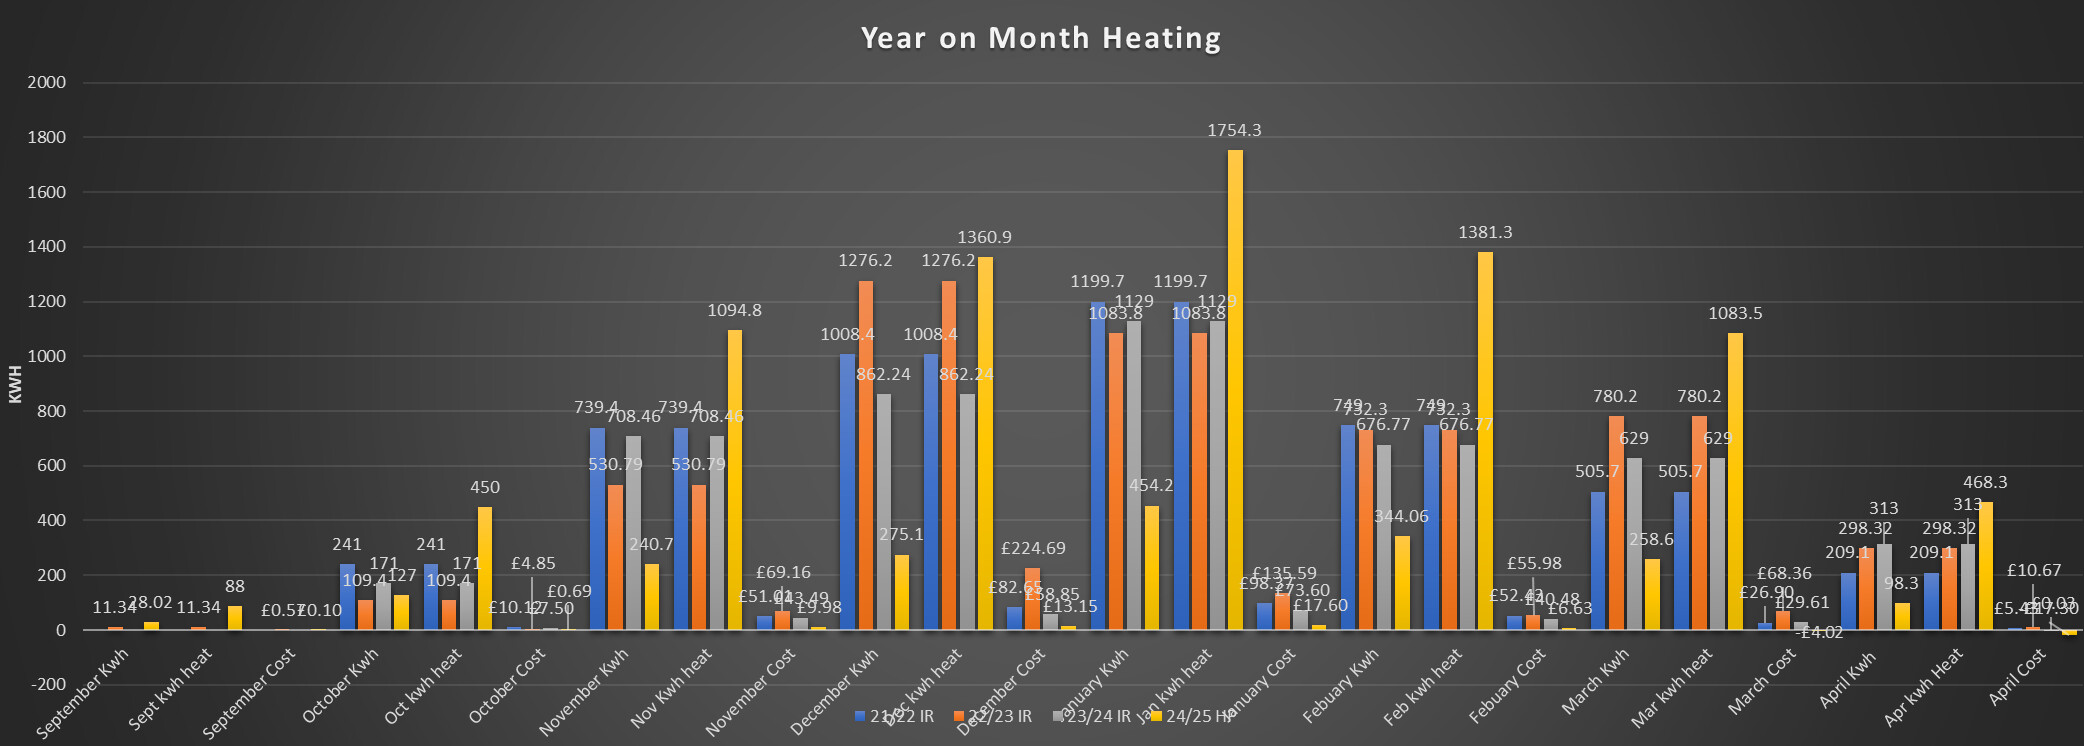
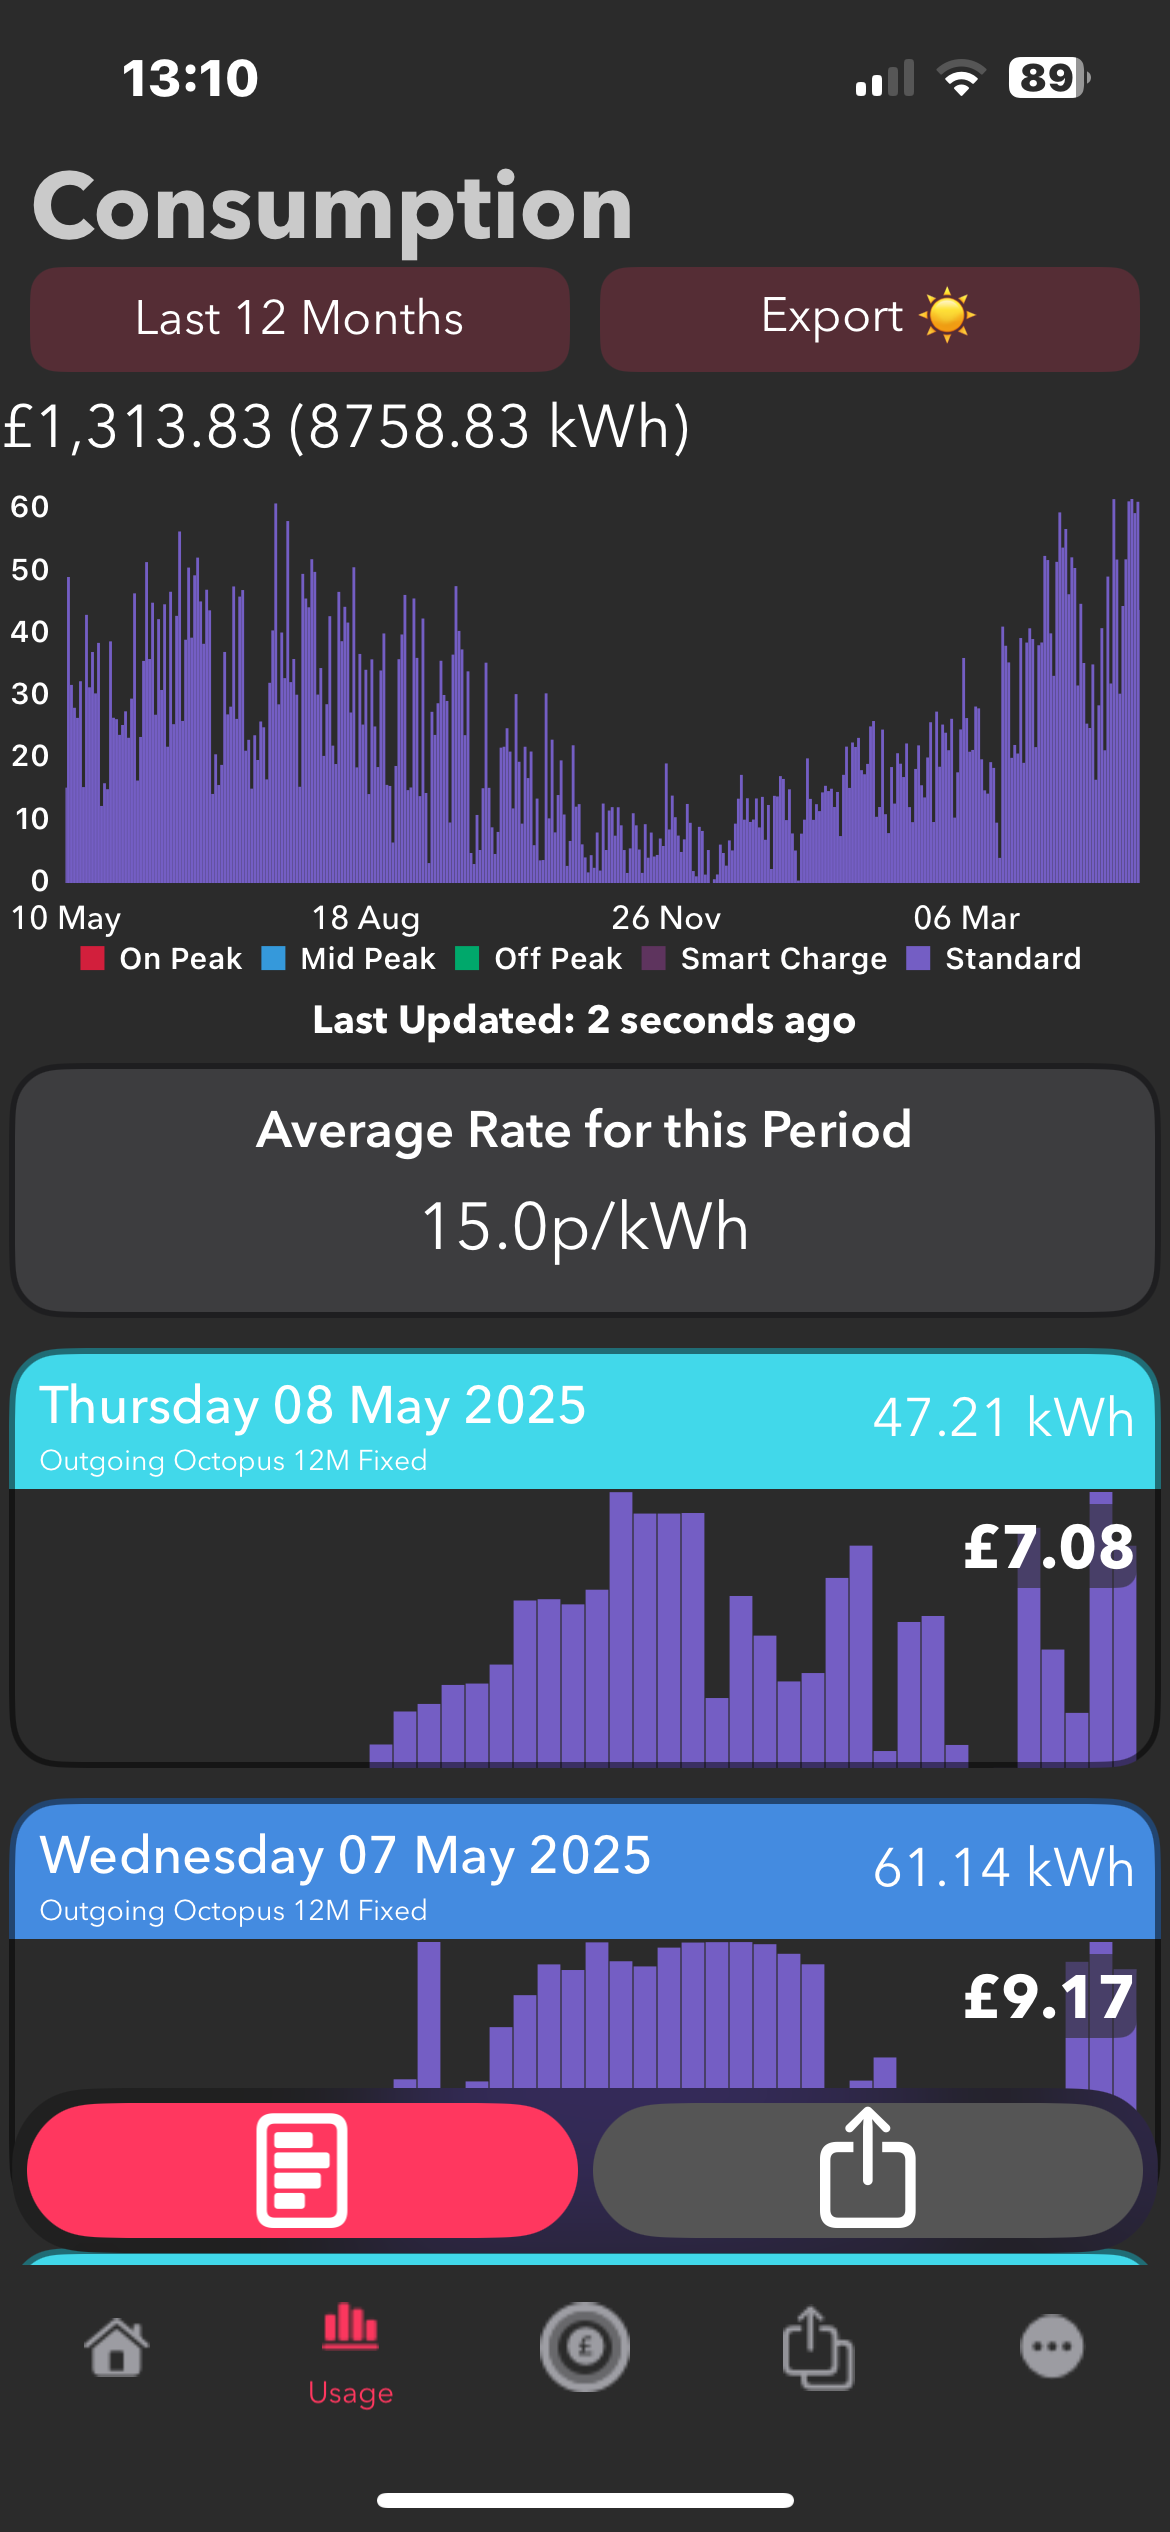
Re the bar chart with 4 years of data - what were the dates for the installation of the ASHP, solar, batteries & EVs? And did the ASHP heating replace gas?
The reason for my original post, is trying to get a handle on the transition to HP bearing in mind that the average baseline electricity usage will be ~3000 kWh/yr (+/- say 500) for an average home reasonably evenly spread over the 12 months. Space heating is what the HP does for ~ 6 months of the year + the annual DHW. So the annual input of gas+electricity can be related in general terms to the gross internal area of the house for space heating + the baseline electricity. This is expressed as Energy Usage Intensity - EUI - in kWh/m2/yr which is the data I’m interested in.
This becomes more complex when solar is added (input/export) and EV’s are plugged in and maybe there’s an office in the garden…..
I see from your overview that you have the 9kW ASHP + 8.5kW of solar + 15kW battery + 2 x EVs, so you would be in ideal before and after example!
Hope you can help.
Solar batteries and EVs are all the same on all 4 years , only difference is I went from direct electric heating to a heat pump
My current heat pump is only 6 kw it was exchanged before the heating season due to a wrongly sized 9 kw pump
Hi Geoff,
Are you aware of the “Heatpump + Fabric” view in the HeatpumpMonitor dashboard?
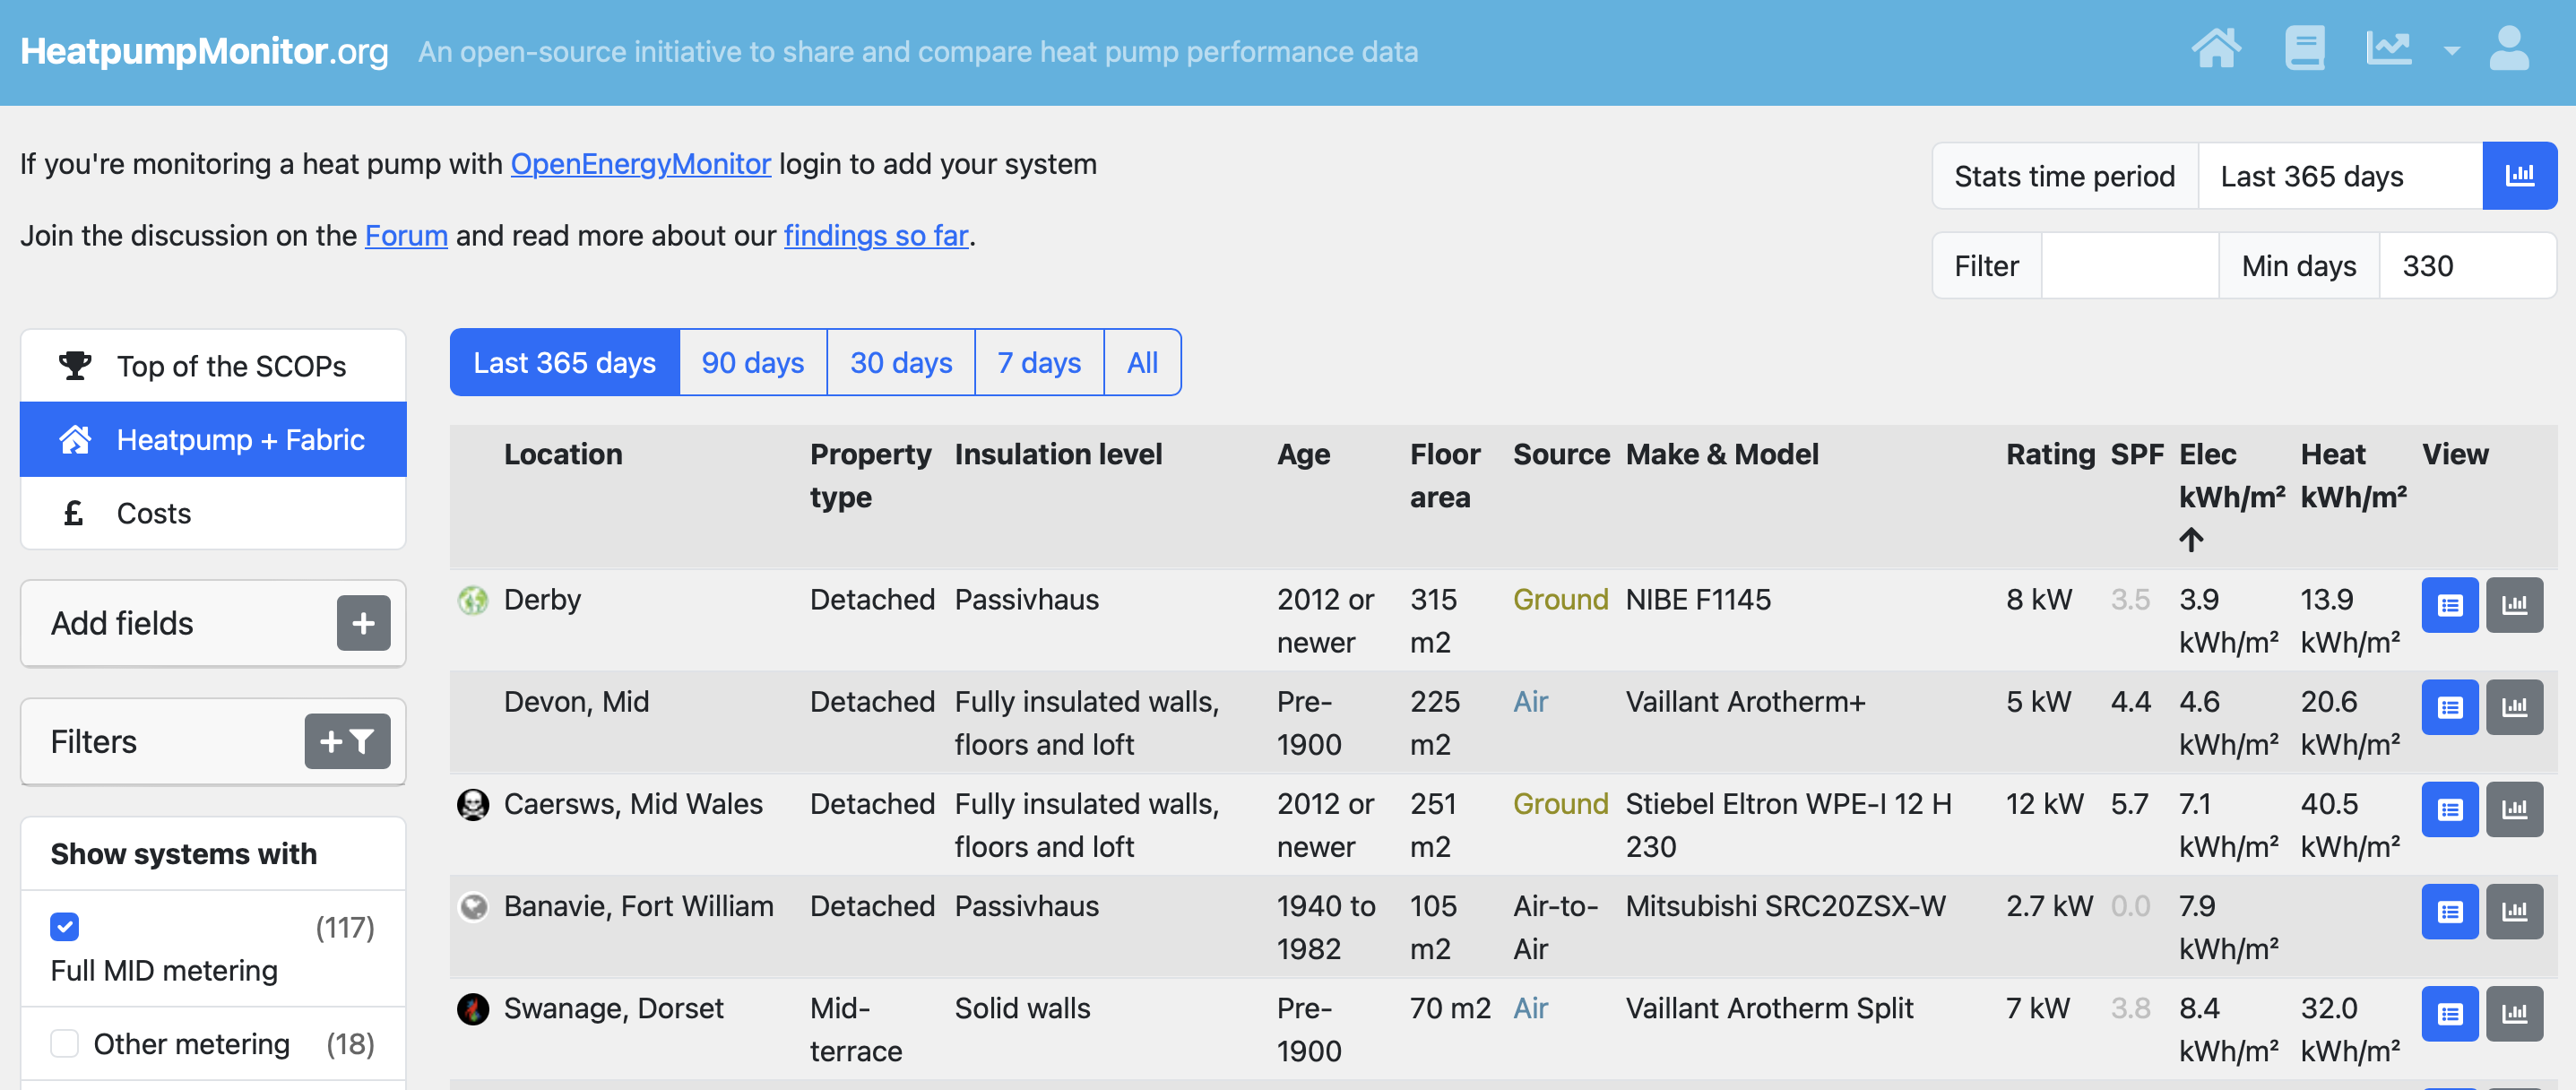
That view shows the kWh/m^2 metric (for both electricity input and heat output) over a selected time period (default is 1 year) which sounds like exactly the data you’re looking for.
The main challenge with making effective use of the data from that view is there’s a huge difference between the ‘best’ and ‘worst’ figures - more than a factor of 10 - so you need to assess whereabouts in the list your property would be ranked, based on how good the ‘building fabric’ performance is (i.e. insulation and air tightness).
The very best-performing buildings beat the Certified Passivhaus threshold of 15 kWh/m^2/year of heat output; about 4 kWh/m^2/year of electricity input (at such a low heat load it’s difficult to get the best heat pump efficiency) - and the very worst-performing buildings can similarly be considered ‘outliers’ - unless you know you’re likely to be at one of the extremes.
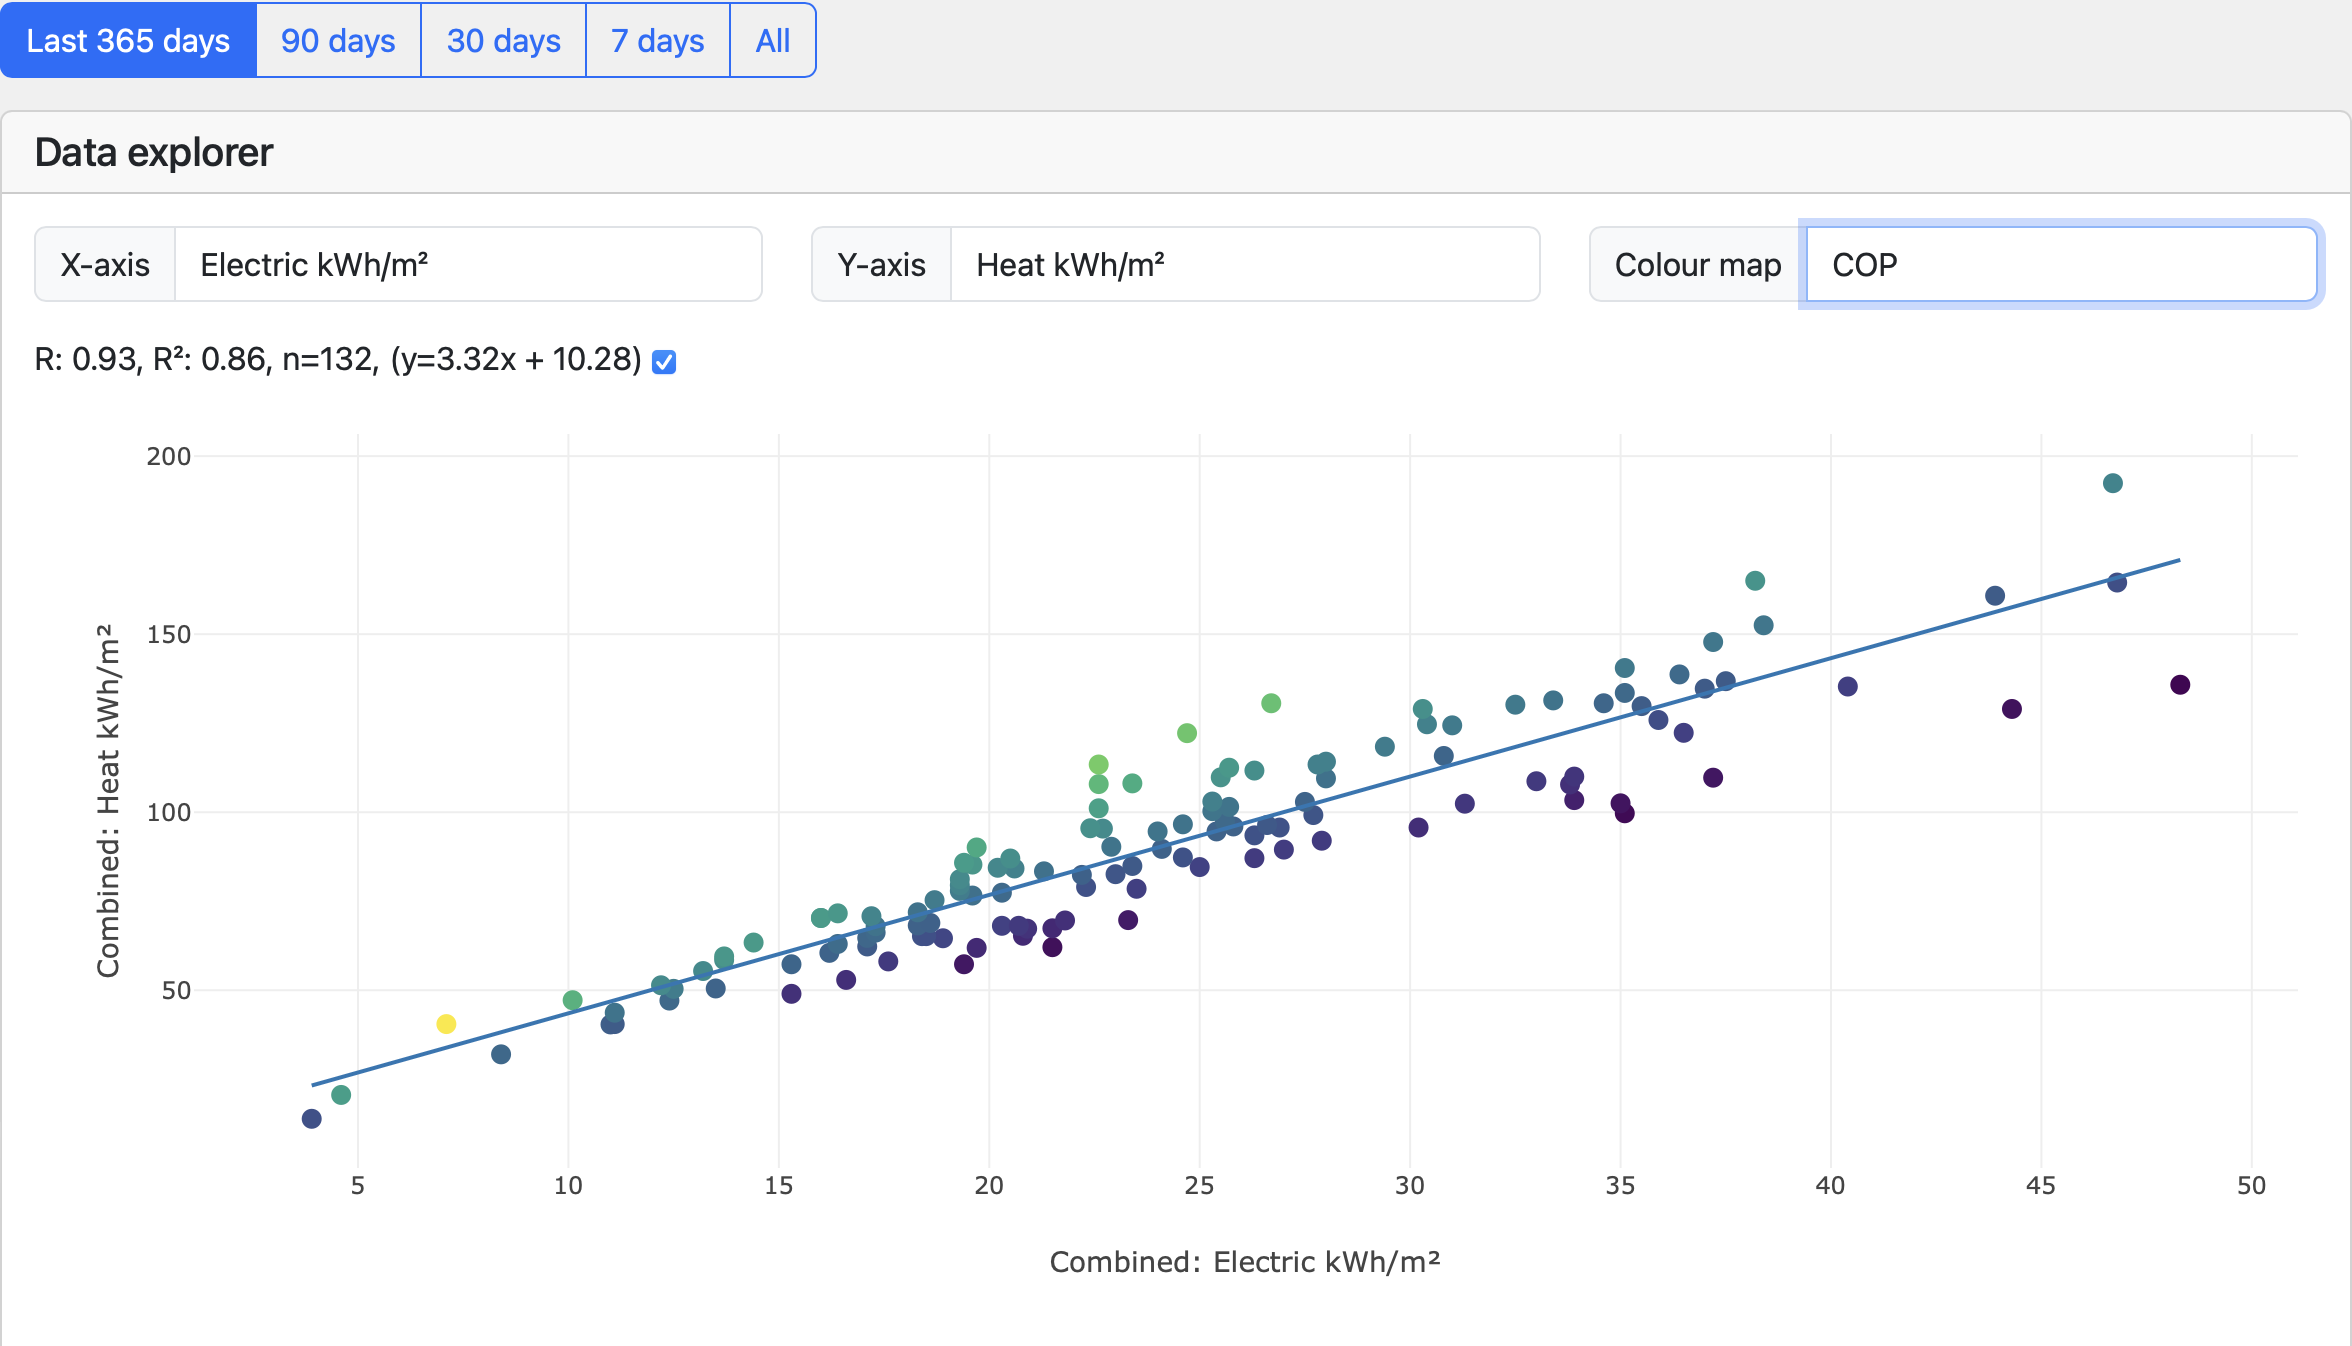
This graph from the HeatpumpMonitor “Data explorer” (toggled on and off with the blue button at the top right) helps visualise the distribution of fabric performance. There’s quite a broad spread but I reckon it’s roughly centred around 75 kWh/m^2/year of heat; 20 kWh/m^2/year of electricity - so those might be decent figures to use as a starting point.
Your original question about cost (p/kWh) is partially addressed by the alternative “Costs” view:
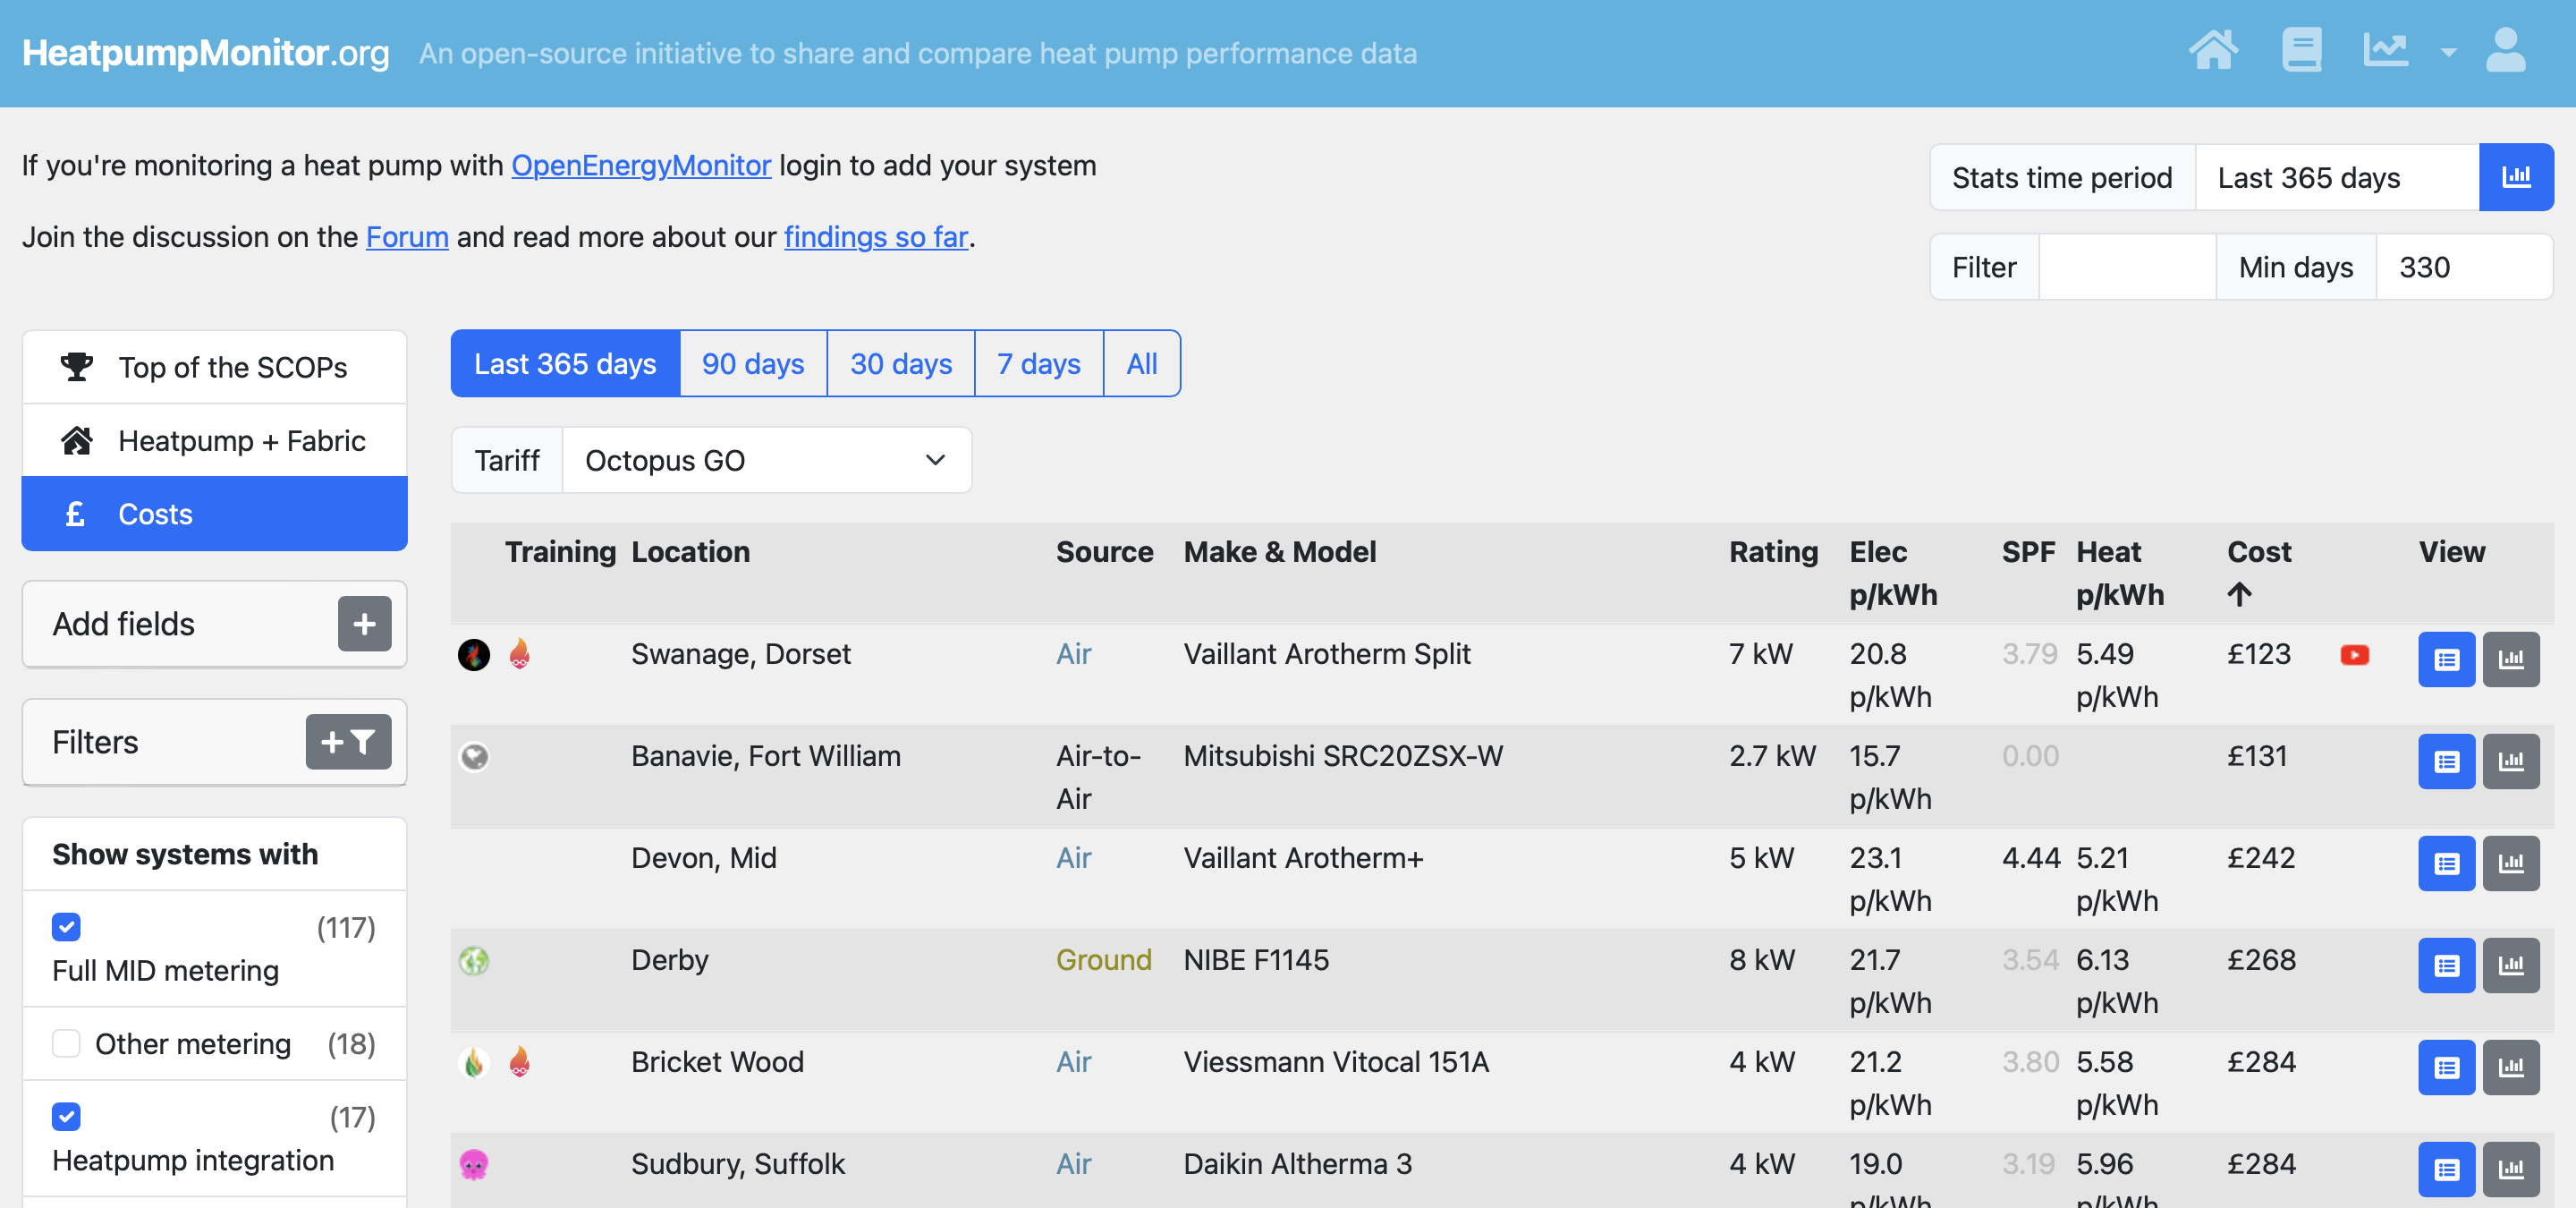
This takes account of the selected import tariff (Octopus GO in this example) and the time-of-use of electricity by the heat pump. Importantly, the “Heat p/kWh” column allows a comparison with the cost of Gas.
The Costs view deliberately ignores any contribution from Solar PV, Batteries etc. If you install enough batteries you could charge those every night at an off-peak rate (say 7p/kWh) then power a heat pump (and the rest of the house) throughout the whole of the peak-rate period - but you’d need to invest in an awful lot of batteries…
David
Thanks David – Apologies, I should have been clearer - my question related to the Heatpump Monitor data and I realised yesterday that I hadn’t explained that or explored the spreadsheet fully!
The origin of my question relates to attempting to predict the energy costs which a homeowner might expect if they have done most of the retrofitting but were unsure about installing an ASHP
Living in ‘beautiful’ historic Bath with it’s Georgian and Victorian houses built for open fires heating with draughty doors, sash windows and gappy floorboards, there’s limit to the retrofitting which can be achieved without gutting the house and starting again.
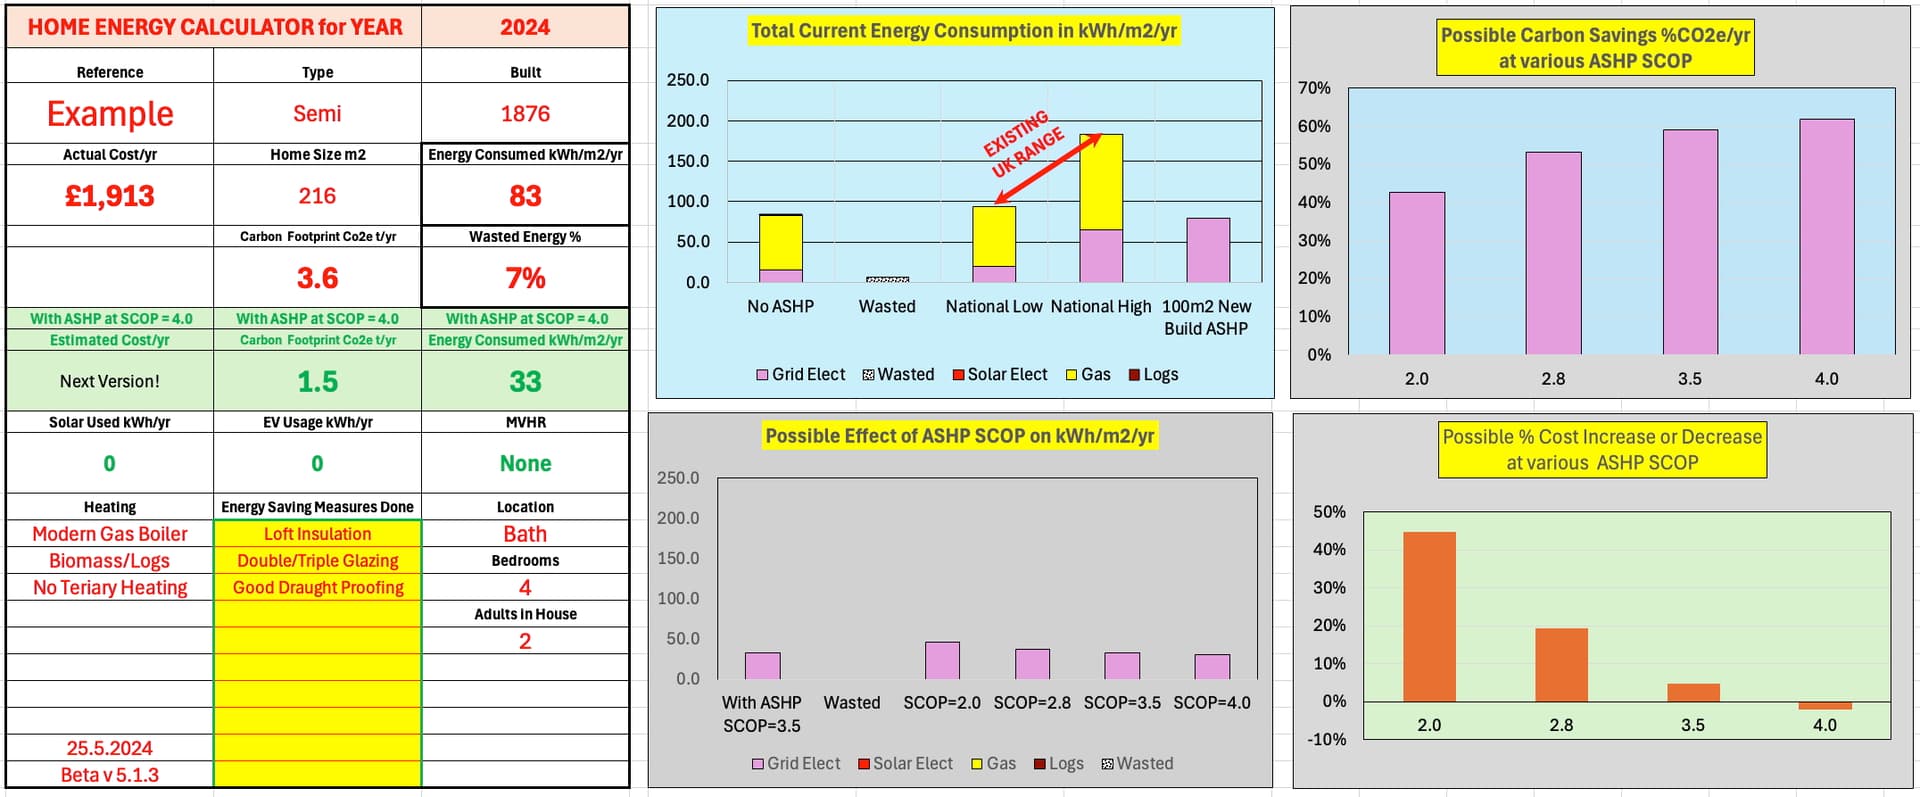
So, using our 1876 Victorian house built of ashlar Bath stone as an example, we have had a simple weather-dependent gas CH system running for over 30 years, for which I have data. The only time we touch the CH controller is when we have visitors, so the evening and morning hall temperature is always at 19 °C and the set back is 16 °C. I have access to a blower door and following double glazing the sash windows and rigorous draught-proofing we are now at 5.6 ACH at 50Pa. Deducting the energy loss up the flue of the gas boiler we have an EUI of 83 kWh/m2/yr gas + electricity input for the last year which is fairly close to your suggested starting point
We are in a conservation area and can’t externally insulate the walls and don’t want to move, so although an ASHP is tempting, at an installed cost of ~£15k (BUS grant deducted) do we want to do this?
We are not alone here, so working with others I’ve devised an initial spreadsheet approach so that at a Home Energy Café meeting we could offer an initial analysis based on a house-holder’s previous year’s energy data. The spreadsheet output is beginning to look reasonable and I’m wondering how to use the best of the ASHP tariffs available to predict a new energy cost. ChatGPT has given me a start and Ovo is the best coming out at 18p/kWh for a whole year.
Here’s the current spreadsheet output for our house which predicts that at a SCOP of 4 the EUI might be 33 kWh/m2/yr with the cost based on our current gas & electricity prices, not Ovo
I want to ensure that the model is reasonable, so anyone with data before and after their ASHP installation that they would like to share would be really helpful.
Thanks - Geoff
Hi Chris – That’s a seriously impressive data set! And if I was much younger I would be taking the plunge and gutting my old Victorian house and retrofitting to see what we could achieve (someone has to do it…..). See my reply to David below
But back to data …. Do you have annual electricity consumption in kWh/yr for the all electric house prior and after the ASHP installations? (Was it entirely heated by IR?) Do you know the gross internal area of the house (GIA)? It’s on your EPC, or you can calculate it. Then you can calculate the EUI in kWh/m2/yr on a year-by-year basis. EUI is very informative for homeowners as it enable them to compare their house (age and type) with similar ones. It doesn’t allow for how warm the rooms are or for the number and age of occupants etc, but it’s a good way to compare homes which have undergone retrofitting.
Can you help? - Geoff
i do have that data set but thought it was irrelevant as our usage has gone up until will installed the heat pump due to going all electric with IR heating and our cars , (i am actually expecting this year usage to rise again due to my daughter purchasing a EV ) so that will be 3 EVs ,
but if you would like to see that data i can share as we have been 100% electric only since 2020 , (when our gas boiler failed )
Don’t you mean irrelevant?
You should be able to edit it?
Hi Chris, below is the sort of result I’m looking for:
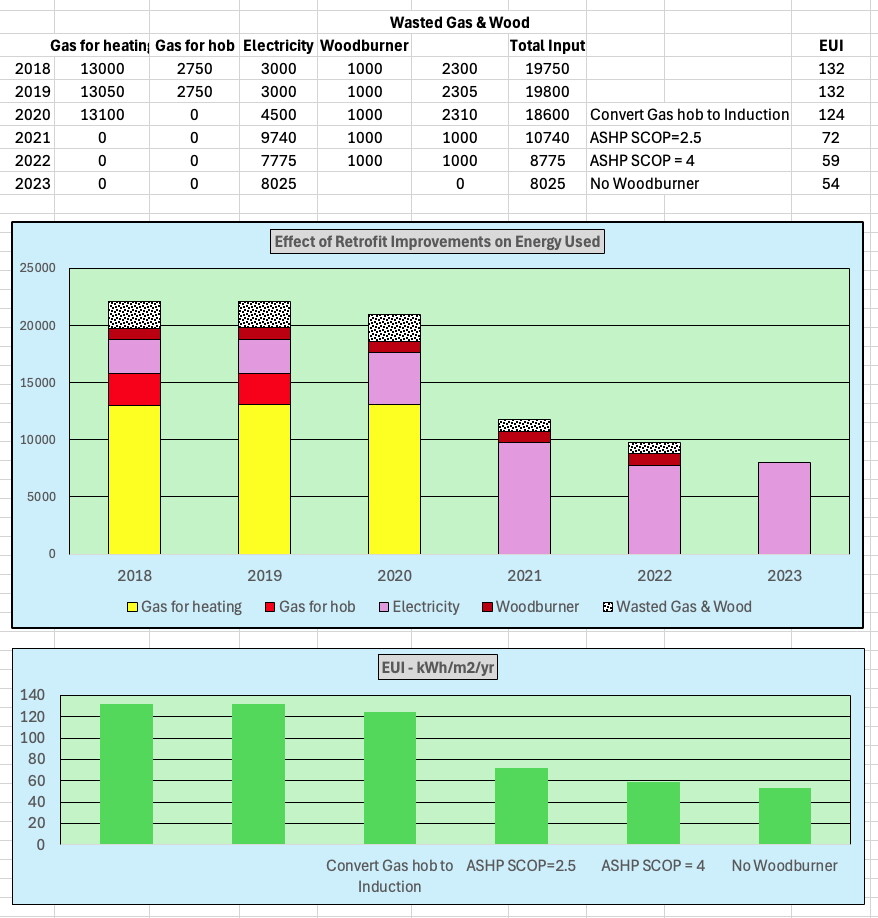
In this 150m2 imaginary house, the heating was initially supplied by a modern gas boiler (90% efficient) plus an woodburning stove (50% efficient). There’s was gas hob which not only cooks, but adds to the house space heating. The occupants use 3000 kW/yr of electricity which a baseline constant in this example. In 2020 the Gas hob was converted to induction, followed by replacing the gas with an inefficient ASHP SCOP=2.5, which was then upgraded the following year to SCOP 4.0 and finally, the wood burner was dumped.
The table shows the heat input to the house and the wastage year by year and finally the Energy Usage Intensity (EUI) which is kwh/m2/year. EUI includes all the energy input not just the heating. Simplistically it’s what’s purchased.
EV usage and Solar kWh exported are both excluded
If you can create a year-by-year data set that would be great.
Many thanks - Geoff