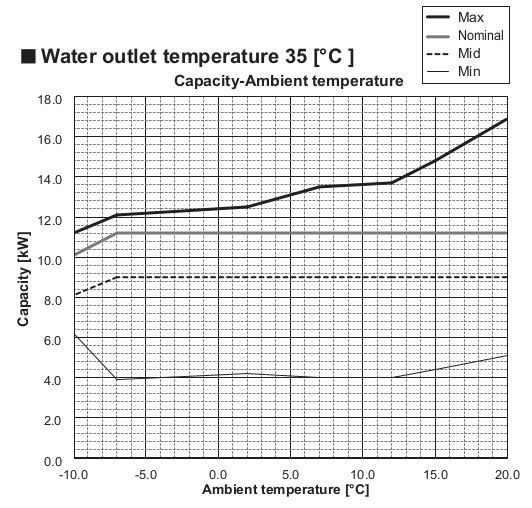
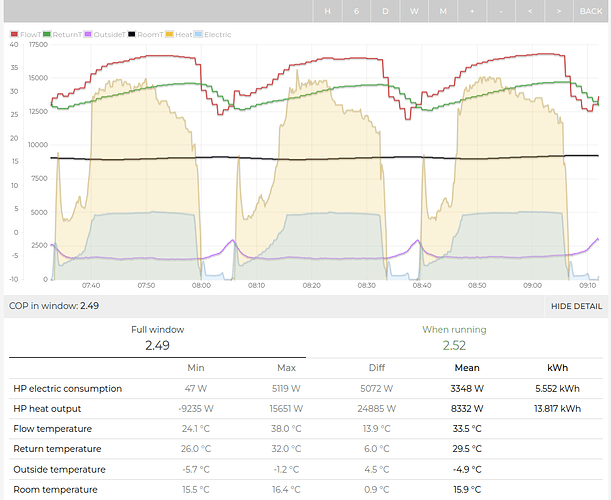
Can anyone explain what is happening to the minimum graph in @Timbones set of graphs above? How can the minimum at -10c be 6kw and yet it is only 4kw at plus 15c???
It is odd, I have no idea why. Maybe it just needs to work harder at those temperatures?
I double-checked the databook again incase I copied it wrong… (11.2 kW)
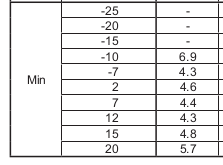
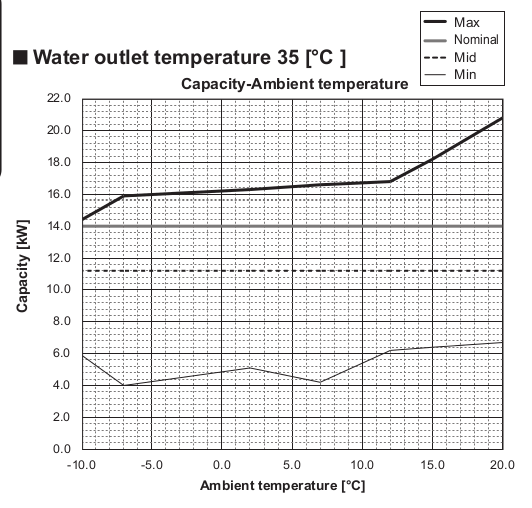
Similar can be seen on the 14 kW unit…
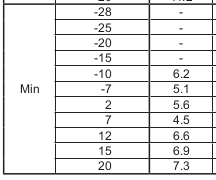
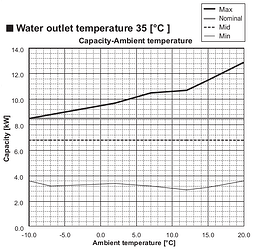
…but not so much on the 8.5 kW:
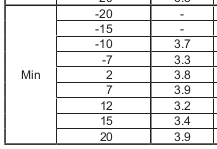
I also noticed these plots that show the COP is best when (this) heat pump is working in the middle of its power range, so aiming to be running at the minimum all the time (as I do) isn’t necessarily the best for performance.
![]()
The sweet spot certainly fits my heat pump experience - it runs very sweetly between 7c and 12c putting out around 5kw for it’s minimum input of 910w. Makes sense that they optimised it as this point as the SCOP figure depends a lot on the performance in this band - it represents 57% of the heating year in my area.
It’s be interested to see the compressor frequency at those minimums - looks like a software minimum limit that gets set higher at lower ambient conditions.
It will be related to avoiding something nasty happening on the refrigerant suffer no doubt.
Mandating that these efficiency maps are published; old at least the best efficiency output and the efficiency at the max/min rated output; would be illustrative
One can then plot “what the unit does Vs design” separately from what the load side asks for.
And “how well the lead behaves with respect to hitting best efficiency point” thanks to control strategy.
Separating the box from how the box is used to target where performance can be improved.
Happy to service your Daikin unit.
Give me a shout nearer the time, we have been picking up some of the broken pieces left behind from UK heat pumps.
Thanks Ken – probably next June. Sorry to miss you today.
Colin
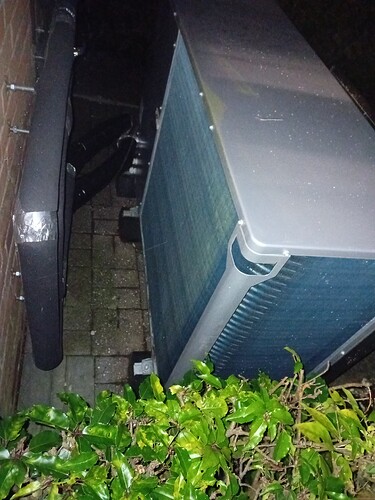
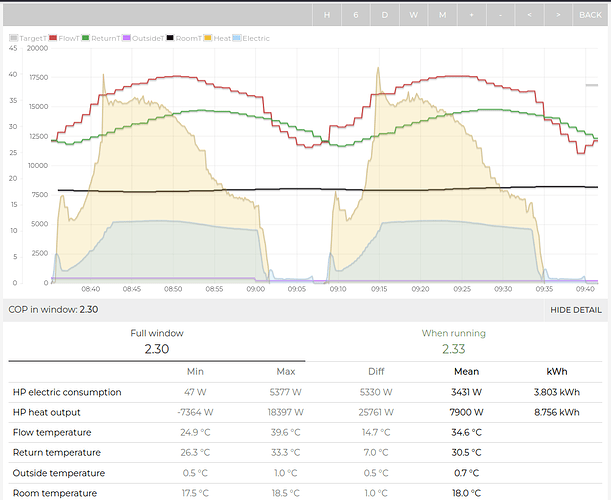
Thought I’d add a discovery about my heat pump in freezing conditions. It is currently 0.3c outside and has not really exceeded 2.3c all day. With my old settings that would have been the recipe for a lot of defrosts and a terrible COP as the evaporator would have been running below zero. However after 5 hrs running without any sign of defrost this is what it currently looks like (0.7c remember).
No sign of frost!
It’s running at a max flow temp of 38c and giving a COP of 3.6 and around 7kw output. I am more than happy with these numbers. The evaporator (or at least refrig 2 temp) is between -2 and -3c.
The secret seems to be not to allow it to push too hard to get to the room temp setting or, even temporarily, allowing a higher flow temp than 38c. My previously high modulation setting of +/- 3c was allowing it to do that as was my wd curve which went up to 40c at 0c outside.
As I have a lot of fancoil capacity then I have found that operating in a very narrow 35c to 37c flow temp range (all year round) and allowing the fancoils (with their own RT controls) to PULL the heat that they need out seems to give a good COP at all outside temps. If it keeps getting colder this evening will be interesting…
Can you please confirm which sensors you are referring to? Are you using ESPAltherma?
Sorry for the slow response Jonathan I’m on hols. I use a different monitor that reads the daikin p1/p2 data stream. This then gets the name… refrig 2 temp …from Daikin…which I assume is the evap input temp.
Thanks Colin. I’m not sure what that would correspond to in ESPAltherma. These values are typically around 0C and a defrost usually happens when they are a bit more negative
Suction pipe temp.(R3T) -0.2
Heat exchanger mid-temp.(R5T) 0.2
That would make sense
- Airflow should be perfectly even externally
- Refrigerant distribution should be perfectly even internally
(i.e. it shouldn’t look like a zebra thermally)
Then run the unit with as stable a load as you possibly can without tipping it over the edge into frosting (no setbacks or room influence / rely on the house smooth temperature swings)
One to add to the programming tips perhaps - removal of modulation at the worst temperatures
An update on this post and test result.
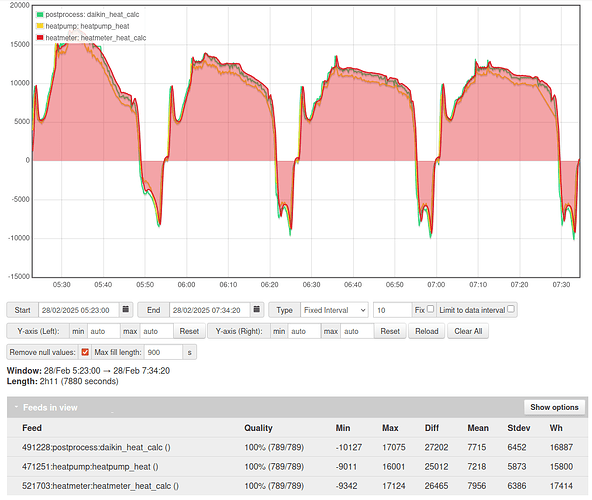
The above test results were based on readings from the internal Daikin temperature sensors and flow meter, read using Arnold-n’s P1P2 MQTT bridge. @ColinS has since fitted a class 2 heat meter in order to verify the readings.
We had been using the Daikin’s own internally calculated heat output, but had also been calculating the heat output separately from the Daikin flow rate and DT between flow and return temperatures. Interestingly the heat meter agrees particularly closely with the latter. E.g in the following example from a few days ago:
- Daikin internal heat calculation: 7218W (9.3% below heat meter)
- External heat calculation based on daikin internal sensors: 7715W (3% below heat meter)
- Heat meter: 7956W
Checking the “external heat calculation based on daikin internal sensors” value for the test above (November 29th 2023), we find that the average output is 9.4 kW rather than 8.7 kW [Dashboard] over the 4 cycles. The 0.6C, 7.8 kW cycle, is now 8.4 kW.
If the heat meter is correct and the actual heat output is 3% higher than the calculation based on the daikin sensors then the average output over the four cycles may have been 9.7 kW and for the last cycle 8.7 kW.
While both of these numbers are closer to the datasheet value of 11 kW, that last cycle at the colder outside temperature still represents a 20% lower than datasheet output.
Test 2
Looking at another test from January 2nd this year
Daikin internal heat calculation 0.7C outside, 7.9 kW output.
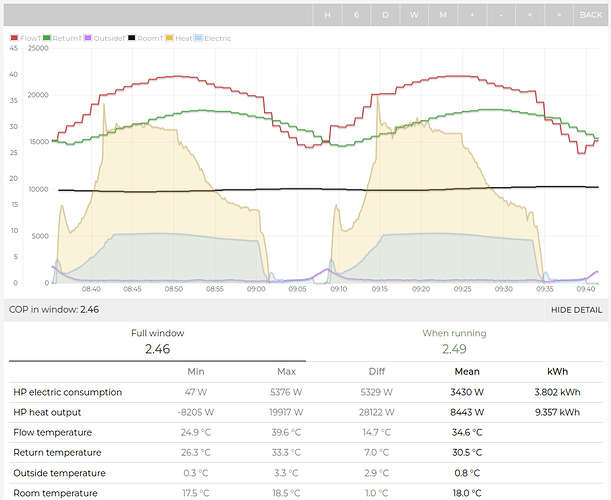
External heat calculation based on daikin internal sensors 0.7C outside, 8.4 kW output.
Adding 3% we would have expected the heat meter to record 8.7 kW, Which is a similar result as the previous test.
The datasheet output at a mean water temperature of 40C is a little lower at 10.5 kW and a little lower still at 35C = 10 kW (Daikin Technical Datahub). The test temperatures are somewhere in middle so perhaps 10.25 kW. The test result would therefore represent an output that’s about 15% below the datasheet.
Test 3:
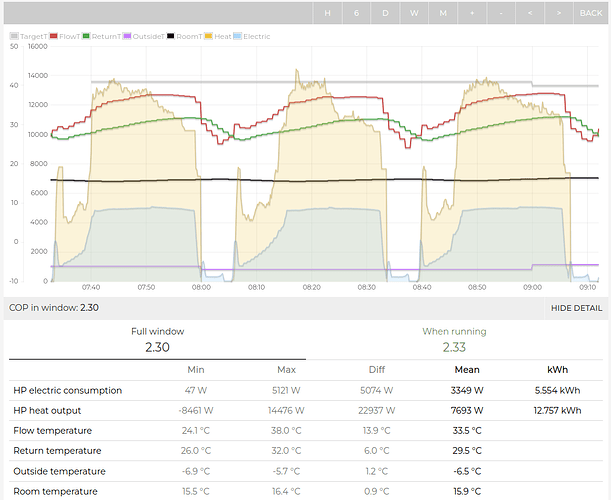
January 11th this year
Daikin internal heat calculation -6.5C outside (metoffice), 7.7 kW output.
External heat calculation based on daikin internal sensors -5C outside (daikin sensor), 8.3 kW output.
Adding 3% we would have expected the heat meter to record 8.5 kW. The datasheet output at -5C @35C is 9.6 kW, @40C it is 10.2 kW (Daikin Technical Datahub). While the average test temperature was 33.5C the peak temperature before the defrost is around 38C so perhaps closer to that 10.2 kW output figure. An overall result that is somewhere between 12% and 17% below the data sheet.
Summary of results
| Outside Temp | Flow temp | Test output | Datasheet | Difference |
|---|---|---|---|---|
| 1.3°C | 44°C | 9.4 kW | 10.95 kW | 14% |
| 0.6°C | 40°C | 8.7 kW | 10.5 kW | 17% |
| 0.7°C | 40°C | 8.7 kW | 10.25 kW | 15% |
| -5°C | 38°C | 8.5 kW | 9.9 kW | 14% |
Is that software limited 16kw?
If so is the software ignoring lost output due to defrosting?
Thanks for the summary Trystan. I’m now convinced that the main difference in the max output we can see in the real world and the test data provided by the manufacturers is down to unrealistic (for the British climate) test standards. As mentioned at the top of this thread the standard tests are at a wet bulb dry bulb difference of -1c. This equates to a relative humidity ranging from 85% at 5c to 65% at -10c. I’ve checked the humidity data on the days Trystan has analysed in the summary immediately above - 82%, ~95% and 100%
As Trystan has pointed out, if you have a design temperature of say -10c, normal on the continent, then a rare foggy day at Zero C will still produce fairly rapid defrosts but a) your system will have a lot of spare capacity so the defrost losses will still allow your home to be heated adequately and b) the unit will not be pushing so hard for max output and c) the evaporator will be bigger and able to take more ice. So the current max output test standards should be adequate.
However when the design temperature is just below freezing, as in most of the UK and the humidity is high and freezing dawn fogs are common, then none of the above is true and the test standard will, as shown above, produce misleading max capacity figures which are not fit for a good engineer to accurately design a system with.
So should we be asking MCS and BS to come up with more suitable standards? Max output at 100% RH at Zero C would be my suggestion??
If you are a numbers person like me then you will see how important water content is in the data below (from Psychometric chart data)
| gH20/KgAir | DB-WB=1c | gH20/KgAir | Dew Point | Spec Vol | ||
|---|---|---|---|---|---|---|
| Temp C | 100% RH | %RH | at this RH | at this RH | Temp-DP | m3/Kg |
| 5 | 5.40 | 86.5% | 4.67 | 2.9 | 2.1 | 0.79 |
| 4 | 5.03 | 85.7% | 4.31 | 1.8 | 2.2 | 0.79 |
| 3 | 4.68 | 84.9% | 3.97 | 0.7 | 2.3 | 0.79 |
| 2 | 4.36 | 84.0% | 3.66 | -0.4 | 2.4 | 0.78 |
| 1 | 4.06 | 83.1% | 3.37 | -1.4 | 2.4 | 0.78 |
| 0 | 3.77 | 81.2% | 3.06 | -2.5 | 2.5 | 0.78 |
| -1 | 3.47 | 80.1% | 2.78 | -3.6 | 2.6 | 0.77 |
| -2 | 3.19 | 78.9% | 2.52 | -4.8 | 2.8 | 0.77 |
| -3 | 2.93 | 77.5% | 2.27 | -6 | 3 | 0.77 |
| -4 | 2.69 | 76.1% | 2.05 | -7.2 | 3.2 | 0.77 |
| -5 | 2.47 | 74.6% | 1.84 | -8.4 | 3.4 | 0.76 |
| -6 | 2.26 | 72.9% | 1.65 | -9.6 | 3.6 | 0.76 |
| -7 | 2.08 | 71.1% | 1.48 | -10.9 | 3.9 | 0.76 |
| -8 | 1.91 | 69.1% | 1.32 | -12.2 | 4.2 | 0.75 |
| -9 | 1.75 | 67.0% | 1.17 | -13.5 | 4.5 | 0.75 |
| -10 | 1.59 | 64.7% | 1.03 | -14.8 | 4.8 | 0.75 |
At max output my Daikin runs with the evaporator about 6.5c below ambient. At half load it is 4 below ambient. At -10c the little moisture in the air will mostly stay in the air as the dewpoint is -14.8c - under test conditions. Whereas at zero c there is more water to freeze out and the foggy day freezeout could be more than 1.5g/kg.
