Apologies if this has been asked or is documented but I am not sure what to search for.
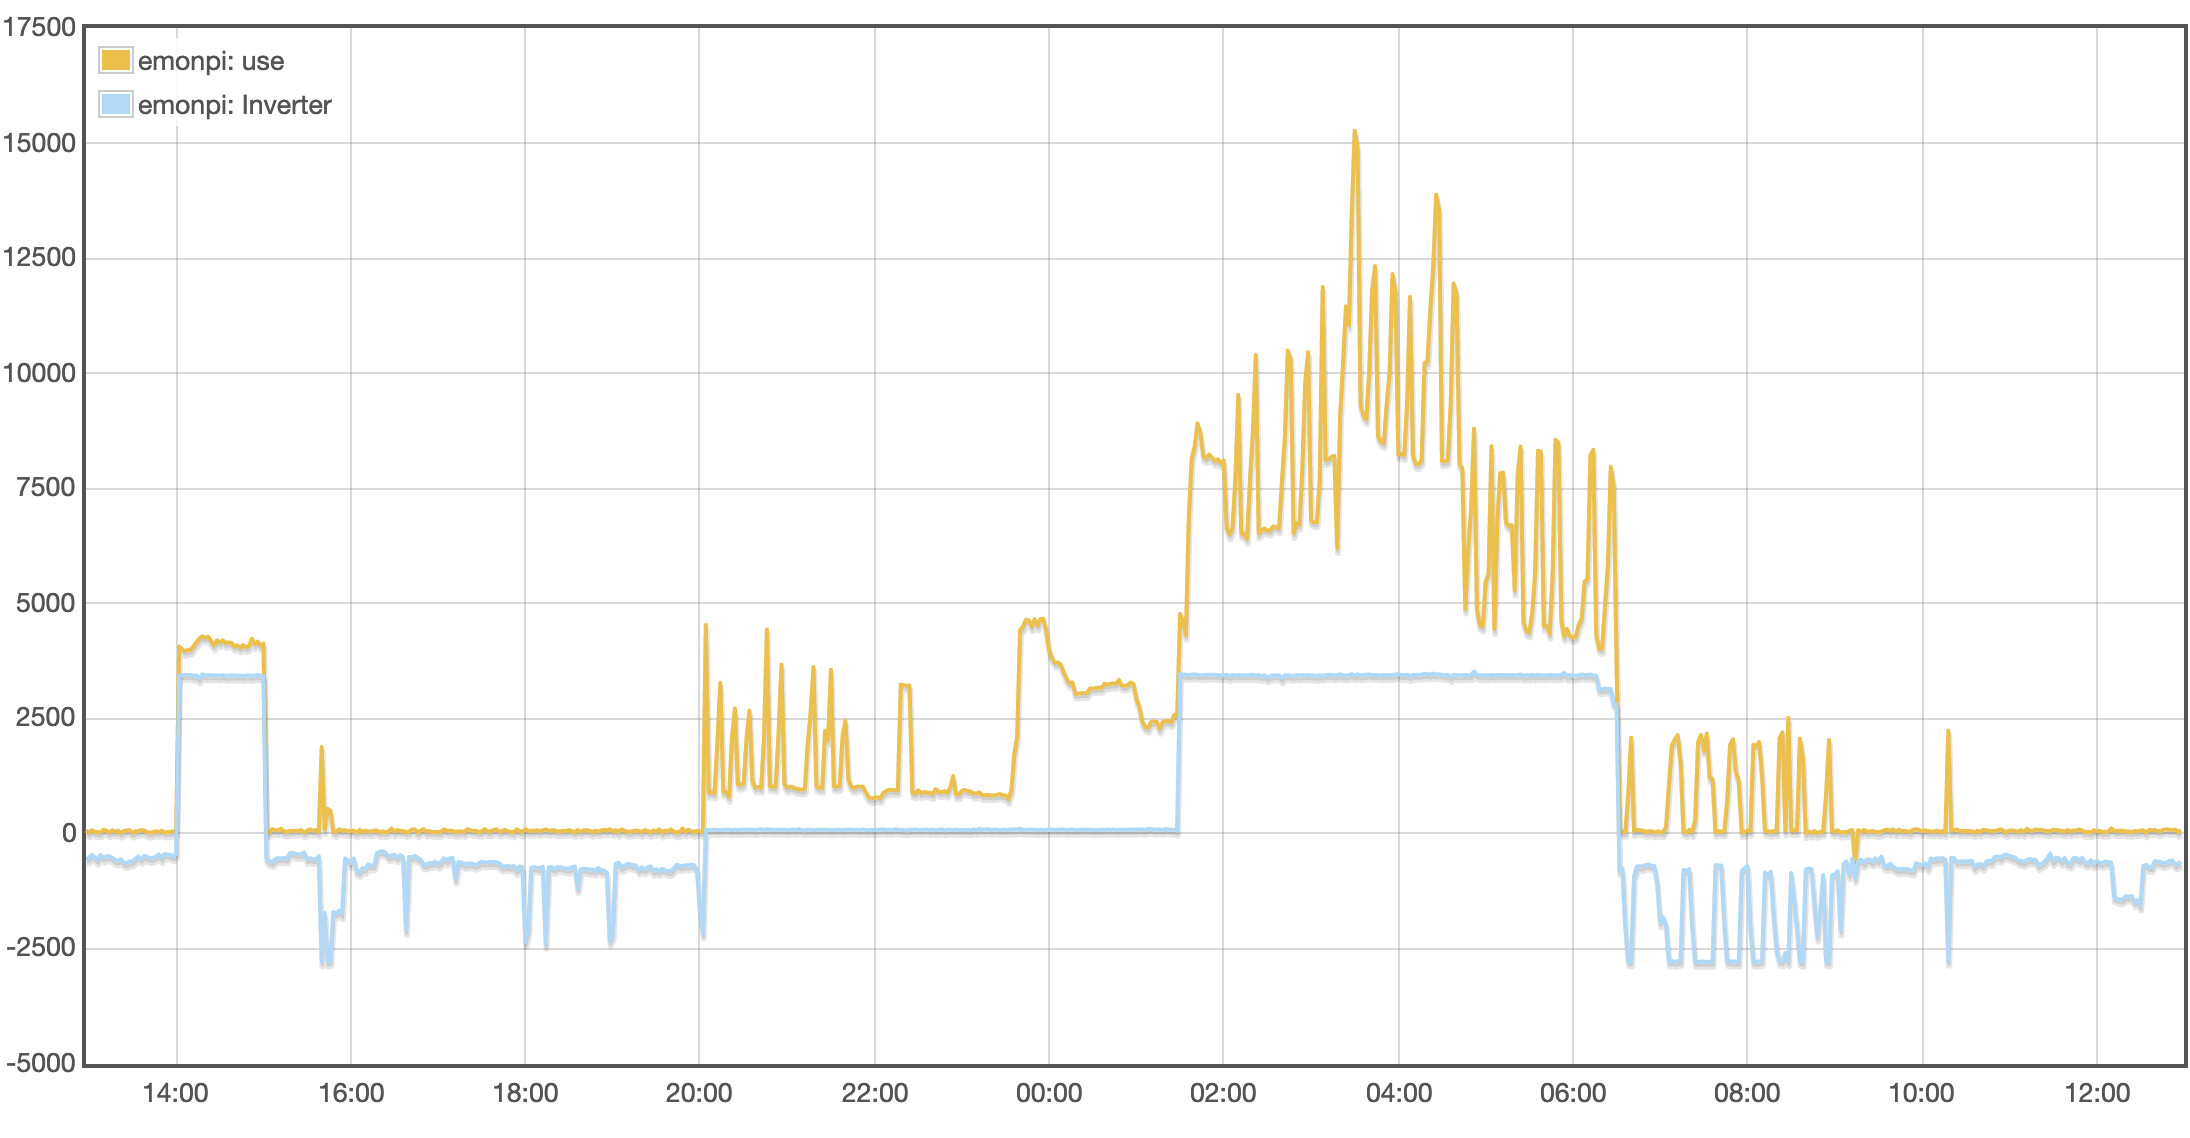
I have attached screenshot showing 2 feeds, ‘use’ which is showing what is being drawn from the grid and ‘inverter’ showing what is going in or out of my inverter and batteries. When ‘inverter’ is negative it means that the inverter is contributing to the load and when its positive its charging the batteries e.g. in the period 0130-0630.
Is there a way of highlighting and area of this graph and to calculate the power used in kWh? so again taking the ‘inverter’ line between 0130-0630 where the batteries are charging from the grid I would like to see how much has been stored, at other times I woudl like to see how much was used?
From my basic maths from a long while ago I think I need the area under the curve but I dont know how to find it!
This is what energy monitoring is all about. Do you know the difference between energy and power, and the units the two quantities are measured in, hence the relationship between them?
What you have there is power. What you pay for with your electricity bill is energy. Energy is, as you rightly say, the “area under the curve”, or the integral of power over time. A further clue to their relationship is the units: power is measured in watts, energy in watt.hours (that’s watts × hours).
What you need to do to obtain energy from power in the digital world is to record the power at regular (and short) intervals, multiply it by the duration of that interval, and add up the numbers you get.
That has all been done for you. If you have a modern emonTx, it outputs “P” values (powers) and “E” values (energies). As you have emonCMS, that too will do the sum for you. Look on the Inputs page, and against each input is a Spanner icon. Click that and you’ll see “Processes” that do the maths. You’ll find one “Power to kWh”. That’s what you need.
If you need to separate import and export, that can be done too, but it requires a few more steps. But it’s a question that pops up reasonably frequently, so you should be able to find it with a search.