just from scrap . i have a ton of dead waverider poe (from my isp operation) their case is the perfect size for the mega/uno arduino form factor all the preexisting holes match up to the power and usb ports. just pretty much open them up toss the insides . and drop in the ardiuno and close them up again
That looks great, Any change of some more information maybe even a build guide?
build guide is pretty easy_ you will need:
wemos d1 r2
mount and join corresponding pin listed above
3.3v - vcc
GND-Gnd
D8- cs
D7- mosi, t_din
D6-miso, T_do
D5-sck, T_clk
D4- D/C
D2- T_CS
D1- T_IRQ
should end up looking like this
and finished product like that:
if you want small form factor just use a wemos mini and mount it directly to the PCB and power it through the usb cable
in the TFT ESPi libarary you will have to modify the pin out to match yours if you follow the above mentioned then you will edit it to look like this User_setup.h :
#define TFT_CS PIN_D8 // Chip select control pin D8
#define TFT_DC PIN_D4 // Data Command control pin
//#define TFT_RST PIN_D4 // Reset pin (could connect to NodeMCU RST, see next line)
#define TFT_RST -1 // Set TFT_RST to -1 if the display RESET is connected to NodeMCU RST or 3.3V
here another updated ino for basic graphing TFT to build dials and bars to work with the TFT_eSPI library – just making it easier for other folks going forward
Graphing_mqtt_esp.zip (4.7 KB)
just edit these line by either adding or subtracting various elements
reading = (inString2.toInt());
DrawBarChartV(tft, 20, 165, 30, 140, -40, 40 , 5, reading , 4 , 0, BLUE, DKBLUE, BLUE, WHITE, BLACK, "TEMP", graph_2); //xpos,ypos, width,height,L_range,H_range,step,reading, font, decimal
reading = (inString4.toInt());
DrawBarChartH(tft, 100, 180, 140, 30, 0, 2800, 700, reading, 2, 0, GREEN, DKGREEN, GREEN, WHITE, BLACK, "Solar", graph_6);//xpos,ypos, width,height,L_range,H_range,step,reading, font, decimal
reading = (inString5.toInt());
DrawDial(tft, 200, 80, 70, 0, 10000 , 2000, 240, reading, 1 , 0, RED, WHITE, BLACK, "GRID", graph_7);// Xpos,ypos, diameter, Lrange, H_range, step, degree
what else would I do , on a -18C day do not really feel like going outside… BRRRRRR!!!
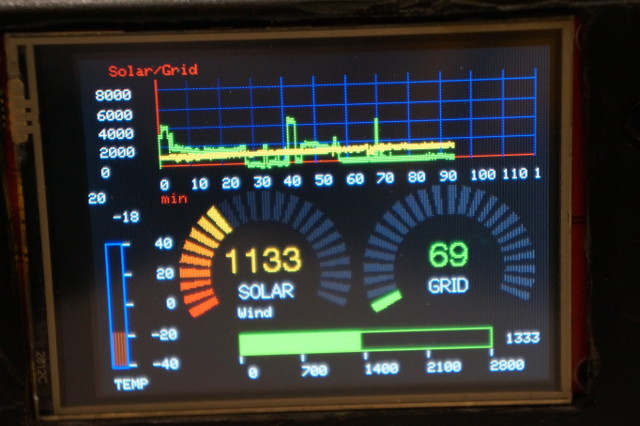
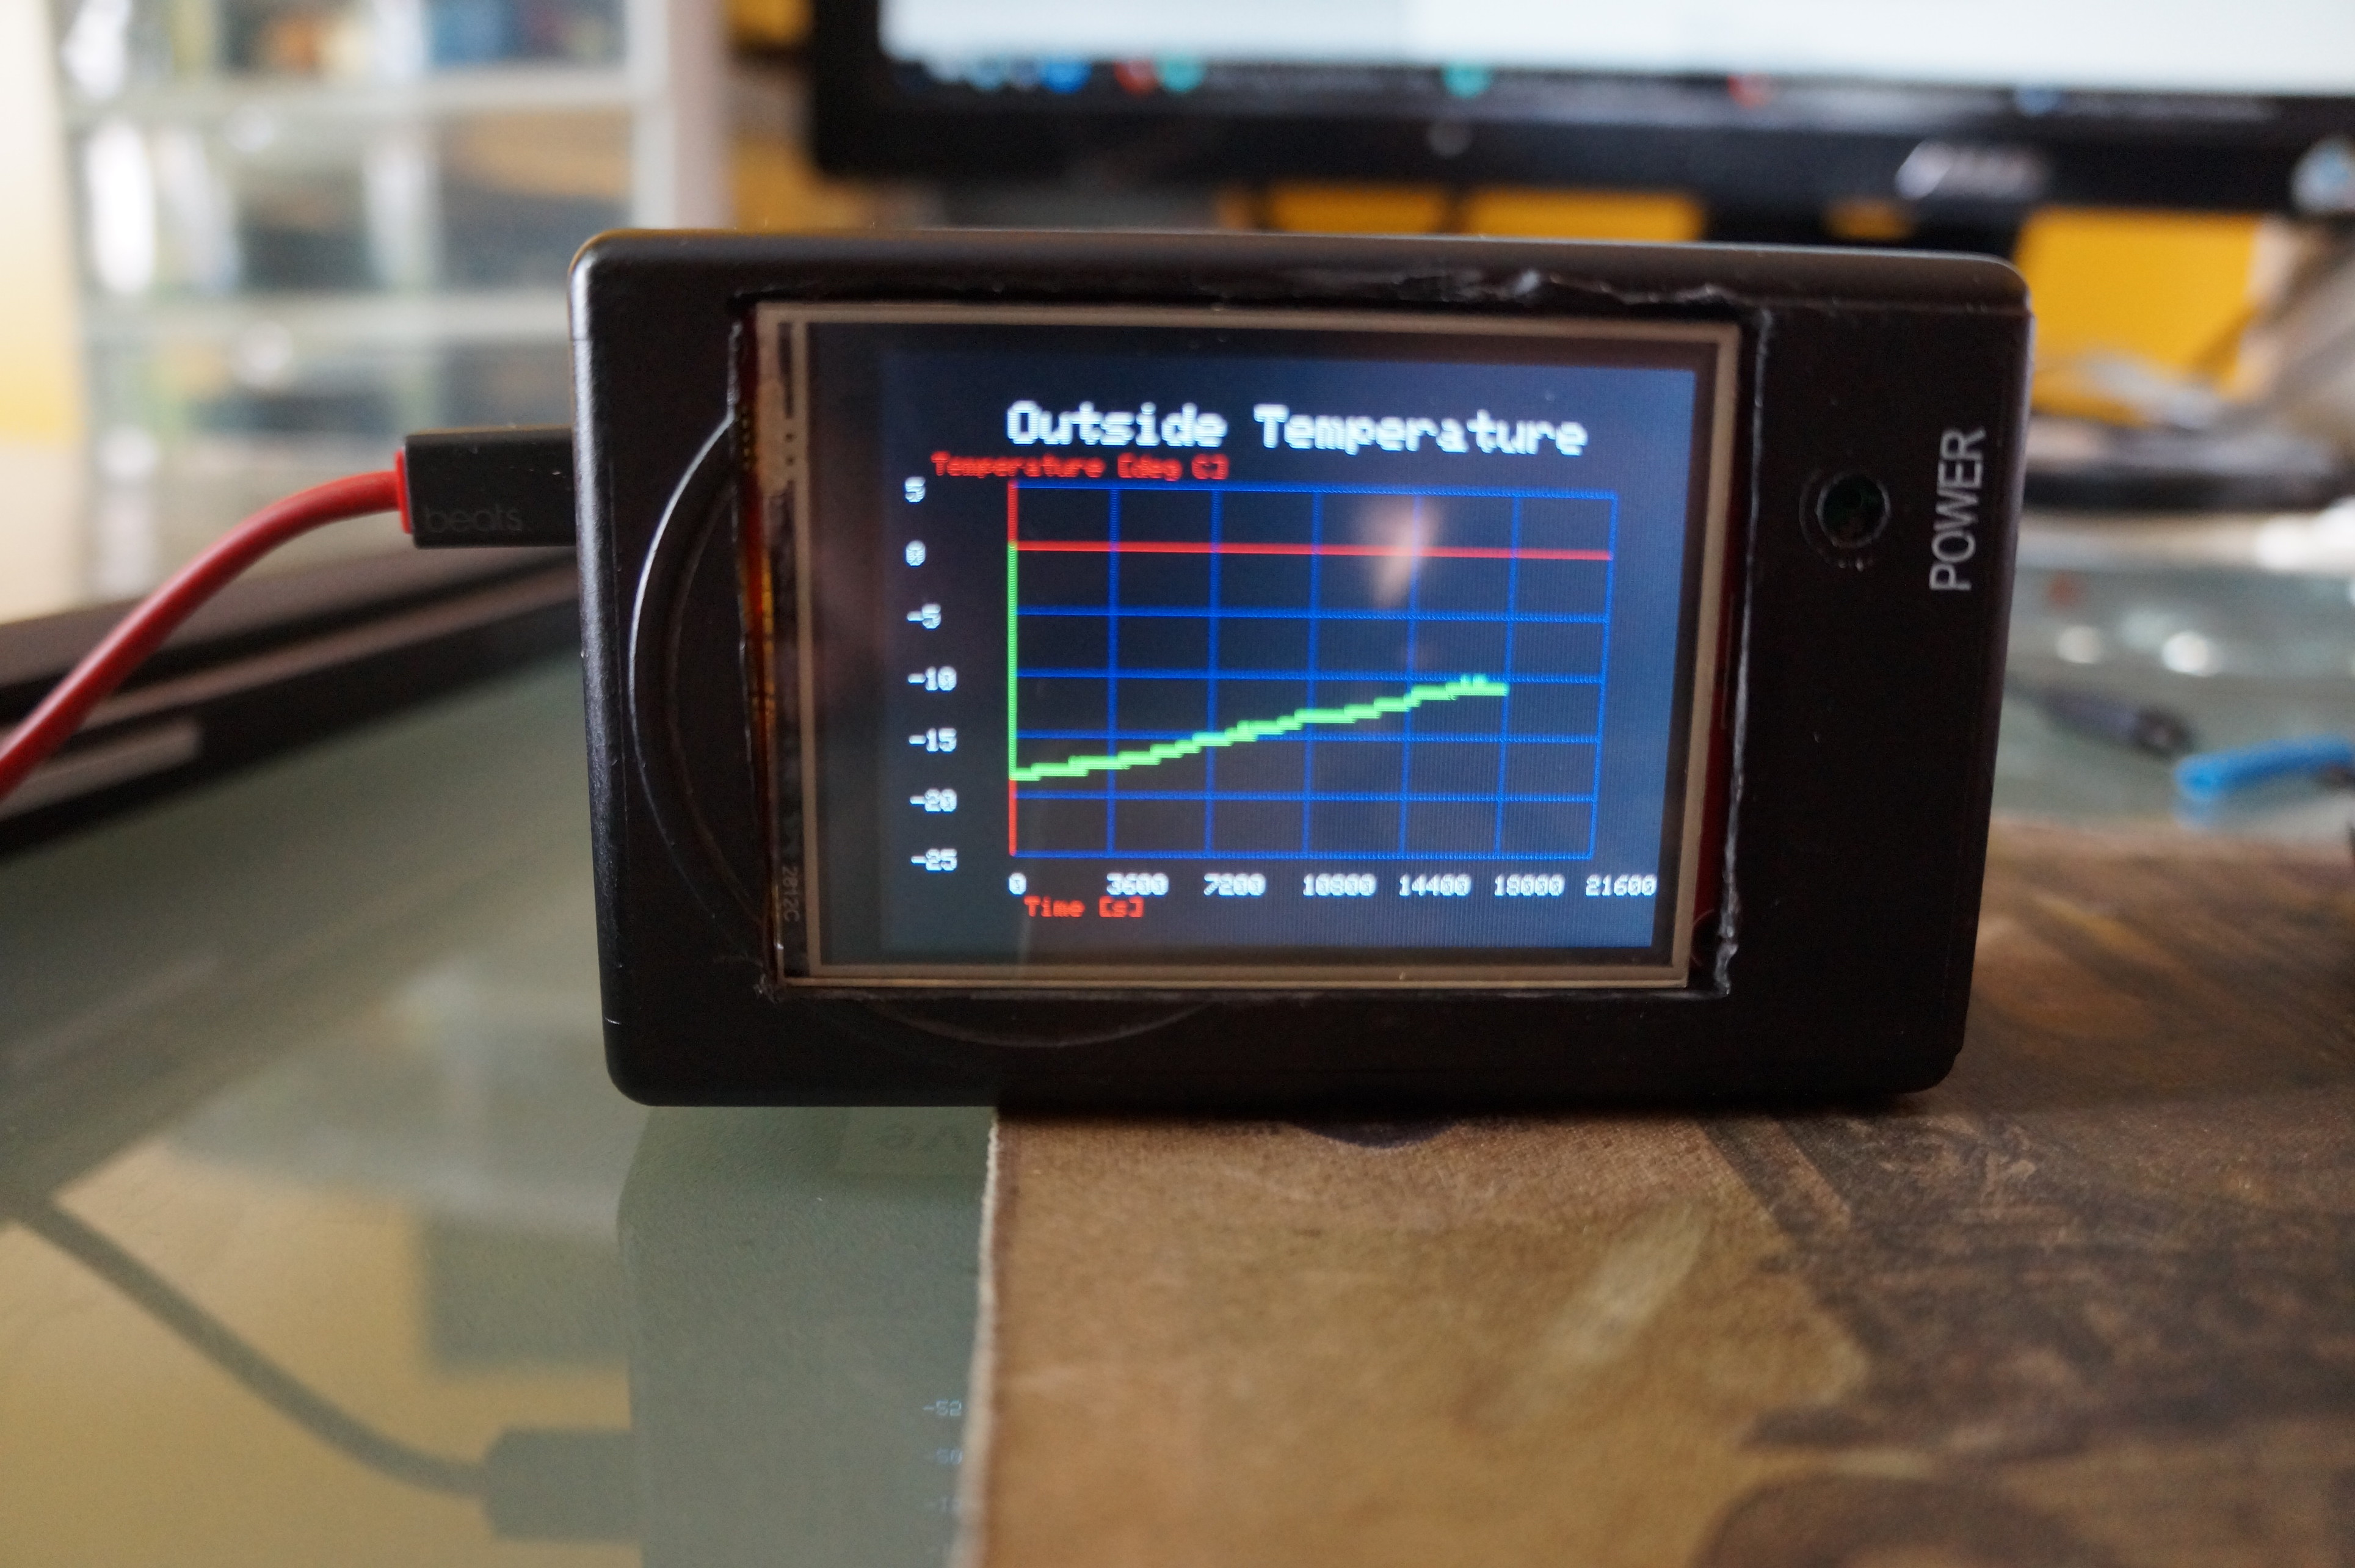
Okay for anyone who wants here a unified sketch for making graphical interface for esp SPI screen and MQTTquickly. just set up position and number of elements and what elements you want ie:Graphs, horizontal, vertical bars . radial dial segment or unsegmented - enter in topic and other network info and away you go… it looking so nice i am probably going to buy a 7 inch or 9 inch TFT that i found for the ESP and make a centralize display panel and micro remote panels with the smaller 2.8 screen seen here
the INO Meter_ring_1_espmqtt-test.zip (6.8 KB)
oops found an error in the code a line needs to look be this
if (millis() - runTime >=(60000* ((Time/2)/60))){
it adjust the timing on when to refresh the gragh
Meter_ring_1_espmqtt-test_1.zip (6.8 KB)
here is the updated version of this sketch on github… it cleans up artifacts of changing reading on the meter ring. also better recovery due to lost internet connection does not mess up the graphs anymore – and added in hostname for easier identification on router
really liking my new method of energy monitoring of using openwrt as my base. all live data is displayed on the esp tft screens. pretty much dropped the the use of dashboard… the openwrt router handles all the MQTT, the historical data is stored in RRD file on USB stick connected to the router and can be viewed if I want ( which is rarely )… the TFT LCD screens and esp are cheap and simple i can place multiple units in my home or at remote locations and they update with live data… i think this should be the last update to it working very well and clean… i might provide another update if require once I get my much bigger tft screen if required
well the 7" screen came in - the driver for it has some nice functionality, if but a little broken here and there i have to sort that out… but here a preliminary view of the it… the company sort of misinformed me on the compatibility towards esp… but it works fine with a ardiuno based board … but no a real issue as i can use a esptoy and plug it directly in the power out put of the arduino board 5V rail to handle the mqtt and pass it too the arduino. but to compensate I bought a couple wemos D3s (which is a mega board and esp8266 combined together …) but for now I just tandem the mega and esp for now as shown until the wemos d3 arrive … Once I sort ot the driver and current graphing issues I will post driver and sketch for graphing mqtt streams and that driver and sketch should be good for all RA8875 screens which should be by the end of this week I hope –
.
okay for those who may want it a unified sketch to drive RA8875 ( 4" - 9" screens) to draw graphs based on MQTT inputs. you can draw horizontal & Vertical bars, Graphs , radial meters and Pie charts. it can handle up to 20 mqtt inputs though I have commented out them you just have to enable the topic names that you want to use… it still needs a little more work on the radial Meter to display a bit more gracefully on large number changes, and the pie chart miss reads for some reason when using 3 inputs I have to sort that out. but first I need to build another emontx shield to monitor the Diverter as all my other CT’s are in use I was using a fixed number for testing for now…
( stuck the LCD and Arduino(& esp) in an old digital picture display)sketches can be found at Github – GitHub - krywenko/RA8875_graphing: Graphing Mqtt with RA8875 Screen
okay good luck have fun
update - the pie chart works fine now for multiple inputs - (my mistake was i was dividing my value by zero- whereas i should of being dividing zero by my value )
looks great! thanks for sharing the code too!
Your welcome- always found it a bit perturbing that people would post their stuff, displaying it functionality but refuse to share the code to make it easier and better going forward. that the the point of opensource it speeds up development much faster then just doing it on your own… and hence why I am always willing to share my code
okay i believe this should be the final update to this RA8875 touch screen. every thing working well. i have not encountered any bugging out in the last few days of running - I incorporated weather under ground into it for the forecast module . i also enabled the touch screen. and where the radial meter exist or should exist there is a hidden screen button. just touch the screen and it will bring up your next set of radial meter – the new sketch s for touch and weather is found on the above github link… there should be enough examples with in the sketches that one should be able to build whatever graphical interface they would like
okay good luck have fun…
was not planning to update this so soon, but it is cold and windy outside so i updated for Two way communication . multiple displays windows and multiple graph options. now divided into 3 quadrants the top bar for meter and informational display - 6 panel option, left hand quadrant for information and MQTT switch control ( ie thermostatic control)- 4 panels option . And Right hand Quadrant for graphing differing inputs, ie solar/grid production comparison, outside temperature, solar and Diverter usage. also 4 different panels
for example the displayed Thermostat if you touch the left hand side of the meter the temperature goes down if you touch the right hand side the temperature goes up they will send a command via mqtt to the thermostatic relay and when the thermostatic relay response to the sent string the green number will display the change in preset temperature
the other one is displaying the forecast weather if you touch the far right hand side of the top bar it diaplays the weather forecast for the day
If I knew if wunderground alerts worked in my area I would add in an automatic weather warning screen… but when I call for it I get blank info so i am not certain it works in my area
to change left hand side display touch the bottom of the screen to display other optional screens
to change the right hand side touch the right hand side near the bottom to display it optional screens
now thinking I should of got the 9’’ display as i want to build it into my wall to be a whole house display center for all information
see github for sketches for 2way communication options
okay good luck have fun
I thought maybe some would be interested of it in action, as i got my wemos R3 and set it up to monitor divert usage and heat pump and couple other devices… my all in one sketch for diversion and grid monitoring work pretty well as you can see from the video as it keep it well within an average of 20 watts or less it will hit a little above 20 watts but you have more under 20 then over 20 … ( it using a bubble search to determine the proper pwm , to bad I can not set the UNo to drive it at 13 mhz then it would be even more accurate as i found out with the ESp driving a SSR at 13mhz pwm you can achieve very good accuracy on 60hz grid … though you can use divisions of 13 but it not nearly as accurate as 13 mhz itself )
if anyone interested
I updated my RA8875 energy monitor display. it still does the same as before but I added in extra functionality
Displays information directly from my weewx compatible device ie: Acurite 7in1 via MQTT sends from weewx
Display information from Mycroft AI remote info screen and EVCAN alert-Skilll
I should of mentioned while it does use the Canadian EVCAN for Canadain weather alert updates on mycroft AI … you could use my metro Alert skill for European weather alerts on mycroft AI and send the warning to the screen in any European Language
I use a wemos mega r3 to drive it
oh and by the way my evcan/metro weather skills do not particularly need mycroft AI to operate they work as a simple background program running every 10 minutes getting weather data and publishing them to the screen that can run from any pi device
Hi,
if I purchase the two boards above and I publish the MQTT feeds from my EmonPi will it work with the setup code you have kindly published (with some tiny mods maybe)
Thanks
John
yes no problem
either edit what your emonpi publishes or edit mqtt_esp8266_2Way_com_AI_WEEWX_ENERGY_monitor.ino to look for how ever you want to publish your info - it basically just looking for single inputs but you could modify to parse json string but for json strings i find it easier just to make a translator that watches mqtt and when the json is published it translates and then publishes the data in single mqtt data points. that way if the json string changes format it easier to change the bash script on the pi then changing esp translation
it has alot of pages but if you are only interested primary display as shown above just edit -( I also disabled the touch in the sketch I uploaded just enable if you want all the other screens and graphs)
String input1 = "/energy/invert";
String input2 = "weather/outTemp_C";
String input3 = "weather/outHumidity";
String input4 = "/wind"; ## is my invereter input as it was made backwards compatible
String input5 = "/grid";
String input6 = "/energy/divert";
.
.
.
#weemw
String input37 = "weather/barometer_mbar";
String input38 = "weather/dewpoint_C";
String input39 = "weather/heatindex_C";
String input40 = "weather/windchill_C";
String input41 = "weather/humidex_C";
String input42 = "weather/pressure_mbar";
String input43 = "weather/windSpeed_kph";
#mycroft and evcan/metro skill
String input44 = "/ai/time";
String input45 = "/ai/offlight";
String input46 = "/ai/onlight";
String input47 = "/ai/station";
String input48 = "/ai/artist";
String input49 = "/ai/song";
String input50 = "/ai/clear";