An Arduino Nano energy meter

I am well on my way to building a DIY energy monitor with Arduino Nano as the computational device. I don’t pretend that this is will be a precision instrument. I present it here, in its incomplete form, to spark discussion about my hardware approach and some question about the algorithms I am using.

The main components are the Nano, the ZMPT101B transformer, and the DL-CT08CL5-20A/10mA current transformer. The power supply that supplies 5V for the Nano is connected directly to the mains. (not only are there ripple concerns, but safety and regulatory concerns, too). I estimate a DIY cost in the neighborhood of US$20-30.

I am designing for a maxium 260Vrms and 20Arms

I am using the 3.3V output of the Nano for the voltage reference for the DAC. I also use this for the bias circuits for the AC signal. This will be a source of error.

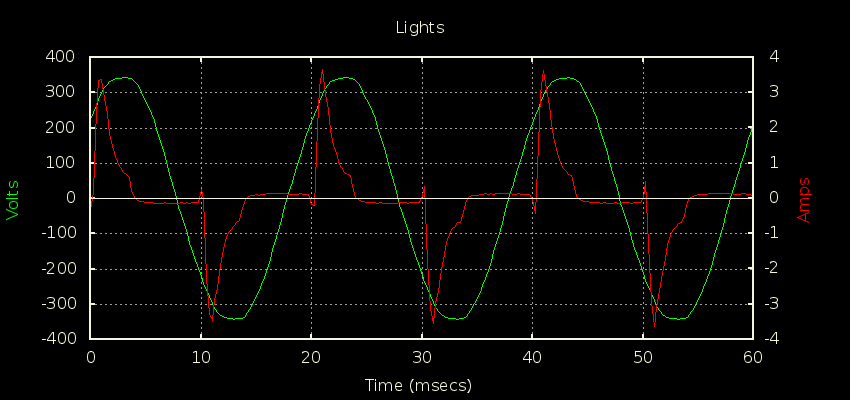
For the voltage my input resistance is 132kΩ (6x22k). My burden resistor for the voltage is 510Ω. I can’t find it now, but there was some discussion about making this value too large would result in distortion of the wave. My bias resistors are of equal value, 39KΩ. Theoretically, this will be 2.98Vp-p, which is within my reference voltage. My 'scope shows 0.44Vrms for a 118Vrms input which is pretty close to 0.45 predicted. The waveform is slightly flattened on the top. Is this distortion caused by the large burden resistor?

I have not connected the current transformer, I calculated a 100Ω burden resistor. I will mount this resistor to the CT to avoid most issues of the CT being disconnected while energized.

Software.

I use the 16bit timer1 to cause an interupt every 1/100th of 1/60th of a second. I take 100 10-bit samples over 1 cycle (a sample takes ~100 μseconds to acquire) Memory limitations prevent taking samples over more cycles. I take the average of the samples to get the DC component. The rms value is determined: sqrt(Σ((sample - DC)2) ) / samples). The rms value of the samples is multiplied by the factor that relates sample value to input voltage (Rin/Rout * Vref/(210 - 1). Actual was close to theoretical, which I attributed to resistor tolerance, though I suspect there are other lurking factors.

Here’s where I’d like some opinions. As noted, the Nano has some serious RAM limitations. Putting data into program space is slow and degrades the Nano.

I am thinking two possible algorithms. The first is to interleave the sample taking between voltage and current. Multiply adjacent values gets power and multiply that by the interval between samples to get energy. This would only be 50 samples though.

Or take a voltage measurement over 1 cycle then current over the next cycle and on the third cycle do the interleaving acquisition and to determine the relative voltage and current zero crossings to determine the phase angle.

I’ll probably try both, but I don’t like working independently so I seek your opinions.

My last challenge will be to send the data to my home automation program. There could be problems with insufficient memory, and using the timer and interupts. (I could offload this task to an ESP8266)

Thanks for being here!

OSD

Have you looked at the actual mains voltage (using a ×10 or ×100 probe)? Here, we suffer “flat-topping” where the crest of the wave is flattened by all the transformer-rectifier PSUs that draw current at the peak of the wave.
It may well be that running the ZMPT101B at 1 V output will give some saturation effects, any c.t. will always be more accurate the lower the output voltage - ideally they should work into a pure current input, but this isn’t practical. You could consider working with the lower internal reference of the '328P.

I’ve been playing this game for a number of years with the Uno (AKA Atmel 328P processor in the emonTx, the same as in your Nano) and you can see the code we’ve used here - it will all be in Github if you can find it.

The ‘gotchas’ are component tolerances as you’ve already mentioned, and you need to design for the worst possible case, i.e. lowest ADC voltage, highest mains voltage, worst d.c. offset, lowest multiplier resistor chain and highest burden values – and then add a bit of headroom. You don’t need to worry about scaling the voltage to the full ADC input range, because you’re not worried about reading a low voltage - 20% below nominal is probably the worst you’ll encounter. You’re much more concerned with current, because there, ‘low’ currents are the norm. I advise you to follow the input configuration we use in the emonTx4. There are disadvantages to the emonTx V2 configuration and I have never understood why that was adopted in the first place.

Another problem you need to worry about if you want real power is the apparent phase error. You’ll have three components to this, the phase error of the voltage transformer, the phase error of the current transformer, and the timing difference between the two samples. The first two will depend on the magnitude of the quantity being measured, so you’ll need to make a judgement about the values to use. The third of course is the sample rate.

The sample rate determines the highest frequency component that you can measure - how high you need to measure depends on the loads you have and how much the waveform is distorted away from a pure sinusoid, bear in mind the cross-products of the harmonic components when you multiply the voltage and current samples evaluate to zero over time - so if you’re only interested in power and not an accurate measure of current alone, it’s not a major concern. But if you want rms current and voltage separately to find apparent power and thus power factor, then it matters. Note zero crossings won’t give you phase angle, because there isn’t one phase angle - the fundamental 50/60 Hz component and each harmonic has its own. Power factor is defined as the ratio of real (active) power to apparent power, it’s only for a pure sine wave that this equates to cos (φ). Ideally, you need to delay the voltage samples by 90° to give you the imaginary (reactive) power, which will tell you whether your power factor is lagging or leading.

Thanks for your insights, @Robert.Wall! They give me confidence that I’m on the right path, one that you have been down.

My focus is energy and the direction it’s going. Voltage and current are good things to have if one is doing a safety check where erring on the side of caution is the rule.

And thanks for turning my head in the direction of the github page.

I see that in order to minimize RAM usage the calculations are done right after the acquisition of a Voltage and Current. This will result in fewer data points per cycle. It also uses a phase calibration constant that must be considered, as you noted, if one wants more accurate readings.

I may have to use this method if I am to get my data to my home automation software.

The advantages of RAM (sample one cycle then calculate) are: pretty straight forward in calulating the DC level, real power, aparent power, leading/lagging and documentation.

OSD

I don’t see that. You’re doing the same calculation, it’s just a matter of when. It’s your choice of course: is it better to have fewer samples per cycle and maybe miss the peak if you have a current wave like this

or even worse, this red current wave

or is it better to sample alternate cycles and double the result?

It comes down to the loads you’re measuring: something that runs steadily for a long period with a nice clean sine wave for the current will be just fine whatever method you use, even the old 200 ms every 10 s of the old emonLib. But if you have something like an induction hob with a current wave full of harmonics and firing a burst every few seconds, then it gets hard and measuring every cycle is getting important.

Incidentally, where’s your zero crossing on that second picture? I can see 6 per cycle, not just two.

Oh! No! You’ve ruined my perfect sine wave world. :wink:

Ok, in your second graph, how do you determine if energy is being exported or imported? Assuming that tthe direction of the current transformer and the leads to which the voltage sensor is connected are known.

thanks :slight_smile:
OSD

Ultimately, it’s the phase relationship between current and voltage. Go and read the ‘Learn’ article about this. An Introduction to AC Power — OpenEnergyMonitor 0.0.1 documentation

I designed and built a prototype of a low cost energy meter. I created a new topic here

Thanks for your input

OSD

I’ve gotten to the point where I’m pretty happy with my results. I’ve been running for over a week now without issue. Irony: the waterproof enclosure costs twice as much as all the components.

You note “You’re doing the same calculation, it’s just a matter of when”. I’m trying to get as many samples as possible in one cycle. Doing the calculation takes precious microseconds. My process is: interrupt, sample V, sample I, check for end, return from interrupt. Sample V or I takes ~115 usec which would afford 72 samples/cycle (60Hz), but there is the overhead processing time. I set my samples/cycle to 65.

As far as actually measuring the mains with my 'scope … I’m scared shitless every time I open the panel. Rational fear is a good thing. In one of my lives I was an electrical engineer for the utility company and had the “opportunity” to climb into a small damp hole with live, underground 25kV lines to diagnose a problem. No freaking thanks, I’ll settle for the error. (I’ve also surfed 6 meter waves and ridden my push bike at 95kph.)

I enjoyed my project it was very instructional. I’d recommend it for anyone that wants to get serious about energy monitoring. But as an actual measurement device, I’d recommend the Emon.

OSD