I have humidity and threshold input/feed coming from hardware nodes.
I have created two graph widgets on dashboard for displaying these values.
What I want is to display a threshold line of 20 to 26 on the temperature graph and a 40 to 60 threshold line on the humidity graph.
The way tried it is by adding dummy inputs for all these thresholds and then create feeds for them.
Then add this threshold to the graph.
But graphs being real-time values, and these thresholds being static one time, it does not display on a graph always.
Is there any way two display such static upper and lower threshold lines on graphs?
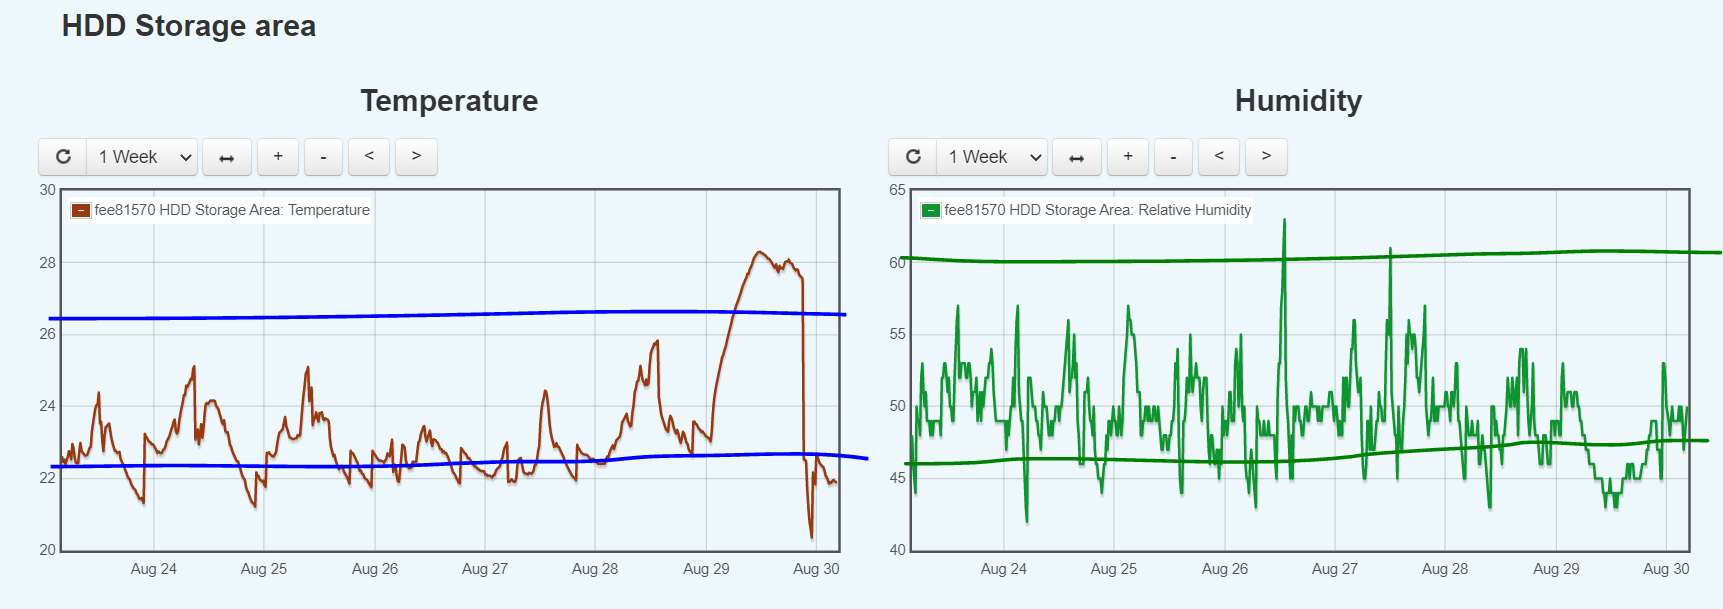
I want something like this.