Just refreshed EmonPi in preparation for a new monitoring setup (to cater for additional PV and an Energy Store).
Previously, in the Input page, headings for the entries were Node, Key, Name, process List, Updated etc…this is also what is shown in the documentation at present.
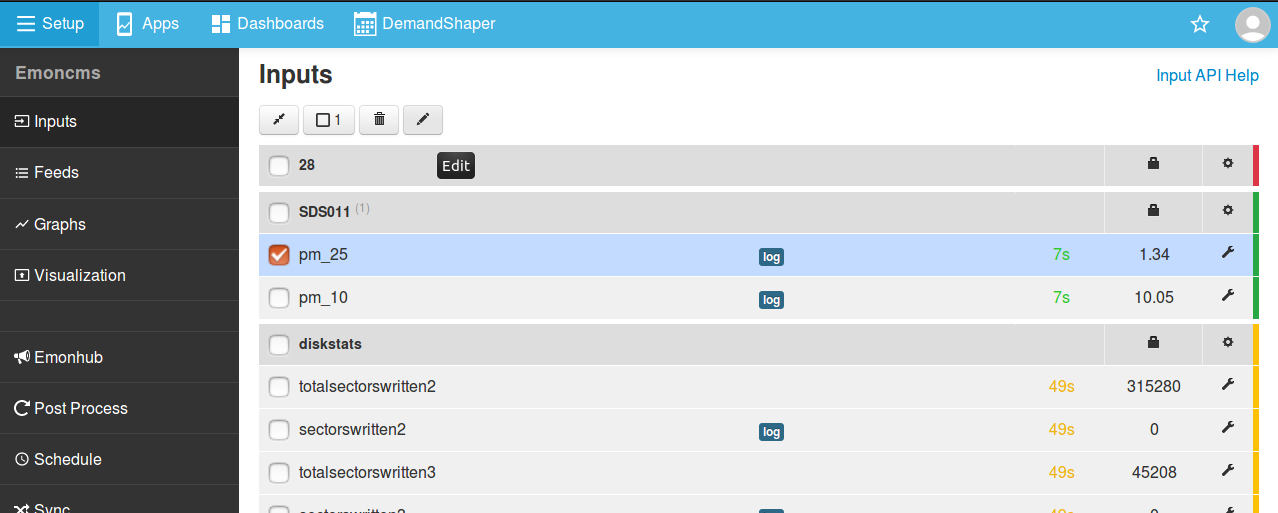
Loading the Emoncms Inputs page now gives a dropdown for each node, but only what was the previously the “Key” for each feed (the default name).
I couldn’t see any obvious means of providing the additional description via the 'Name" facility - which was tremendously helpful in giving meaningful descriptors. I found a comment on GitHub re the latest release referring to an ability to Edit Feeds (#1446) but banner referred to isn’t on on Inputs page.
Am I missing something in the config/setup for this new version or has there been a change?
So a little further forward - I had seen the banner in (i think) the GitHub issue @borpin referenced.
I was puzzled as that banner definitely wasn’t displayed, regardless of a feed being selected or not.
For me at least, it appears to be a browser issue/sensitivity : no banner, feed selected or not, using Safari; displays with no issues with Chrome & Firefox (both on Mac too).
If I edit & add a description in Chrome, then save & reload the page in Safari, then the description now shows, but sign of the banner or headings
Does that help? (I’ve checked and JS is enabled - the only obvious related setting)
My POV - shy banner notwithstanding, the lack of headings is certainly “cleaner” but they did aid insight for a first time/occasional user.
Thanks for the feedback @burble61 The browsers we target for support with emoncms is Firefox and Chrome (these are the ones we test and develop with). However it would be good to track what works and what does not in Safari in case we can improve support for Safari as well.
If you can spot any other differences between firefox, chrome and safari that would be useful to know. I will add them to the list and see if we can address them in future.