What exactly is incorrect and what were you expecting? I’m guessing it wasn’t negative values?
What is the relationship between the 2 graphs? One is of feed 22 and the other of feed 23 are they related? Are they both virtual feeds?
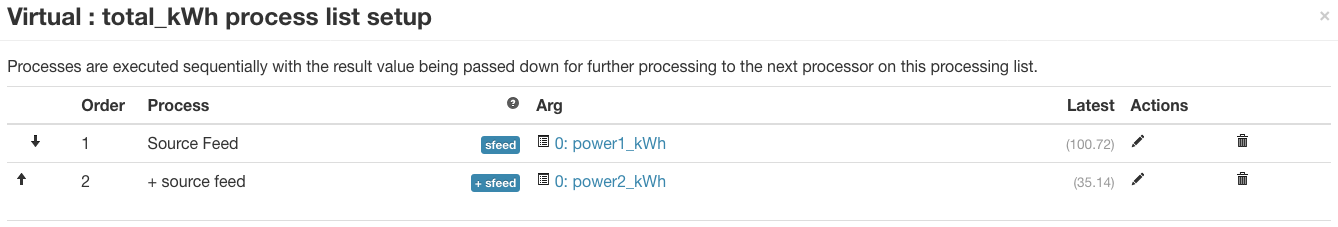
Which if either, is the “total_kwh” virtual feed? Is that part working ok?
Are neg values at all possible in any of the source data?
Is it possible that you got one of the feed ids wrong and thought you are looking at the same data in both graphs? If that’s not the case can you expand on the context and issue?
[edit]
I just noted they are even different src urls so I guess it’s less likely to be just a incorrect feed id “typo” ! What is the correlation if they are indeed from different servers?
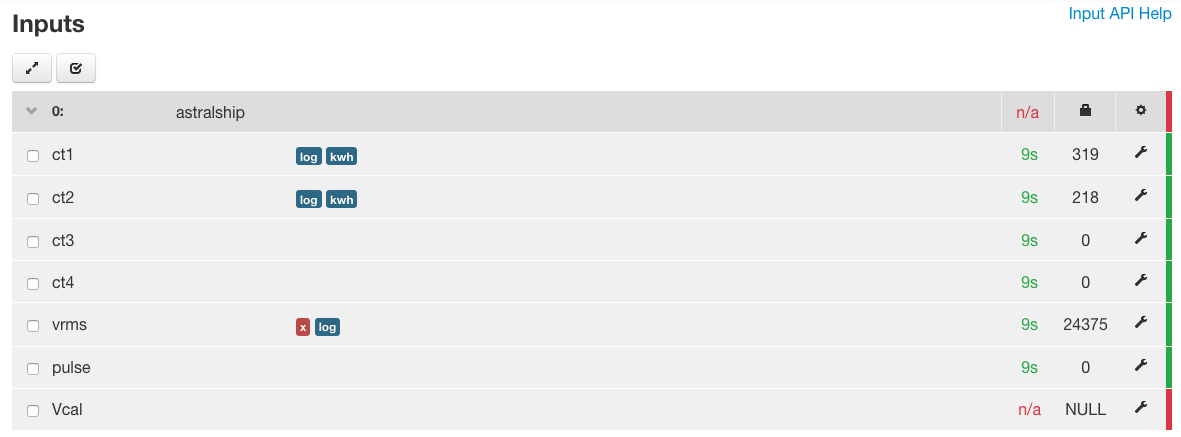
That’s right. After a month of data it’s a strange event. I’ve checked the Vrms feed just in case, the Voltage readings are solid. CTs (power) looks fine too.
Feed 22 is one of two power_to_kWh feeds. Feed 23 is the virtual feed screenshotted above.
Edit: feed 22 is just power, not power to kWh.
Feed 23. Working fine. The negative values might be because of something wrong with the virtual feed. Or there could be an issue with something else, not sure what’s possible to go wrong.
Neg values are possible in emoncms software side, there is no filtering input process. However, hardware side there’s no reason for neg values to exist. Nothing here is feeding into the grid.
This is just mDNS being daft, I hear it often is! Same rPi at work.
Wait… Feed 22 is just power, not power to kWh.
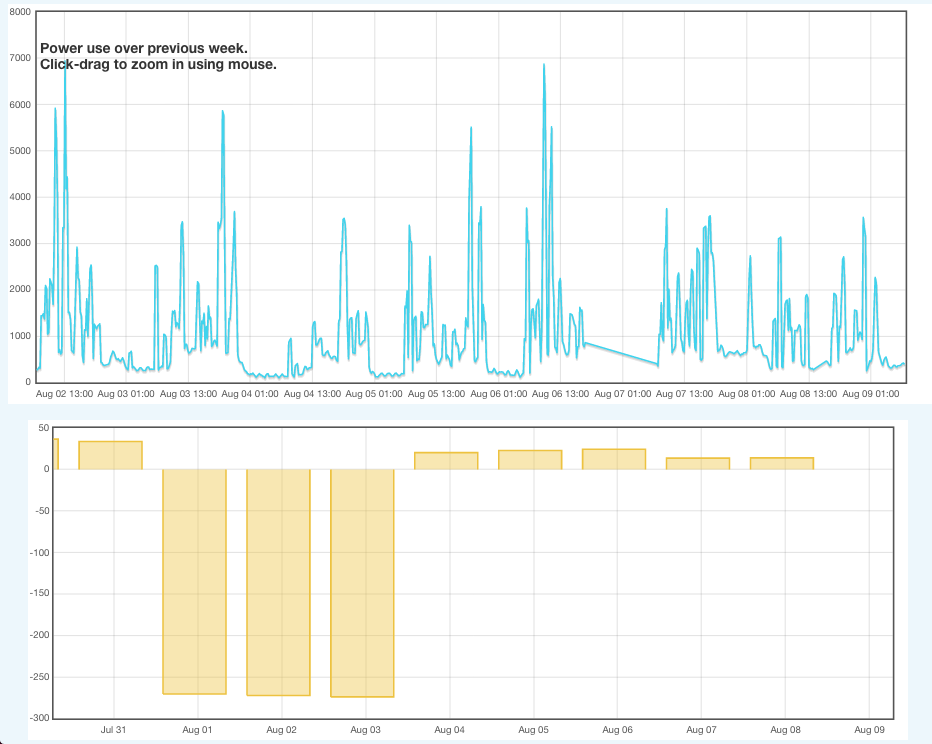
I included the power graph to indicate how it is normal looking.
… To emphasise that something seems not right with the virtual feed graph.
There is no way for us to get any idea of the correlation between the various feeds data with the graphs you’ve posted.
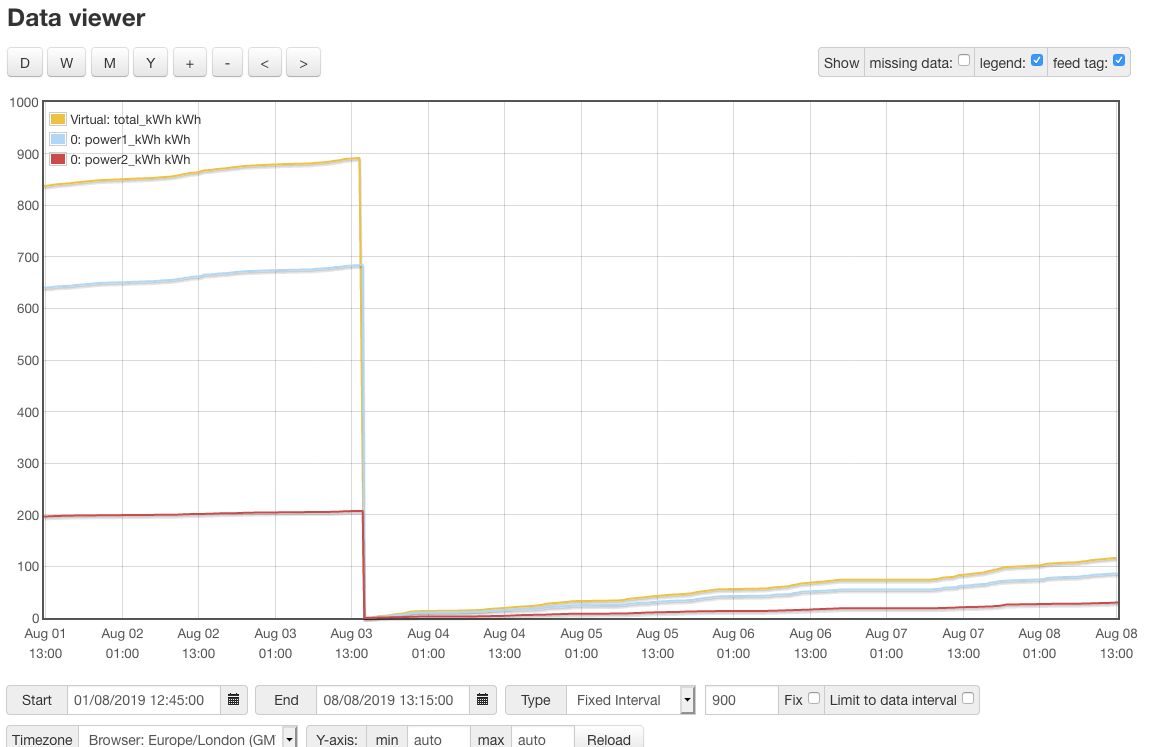
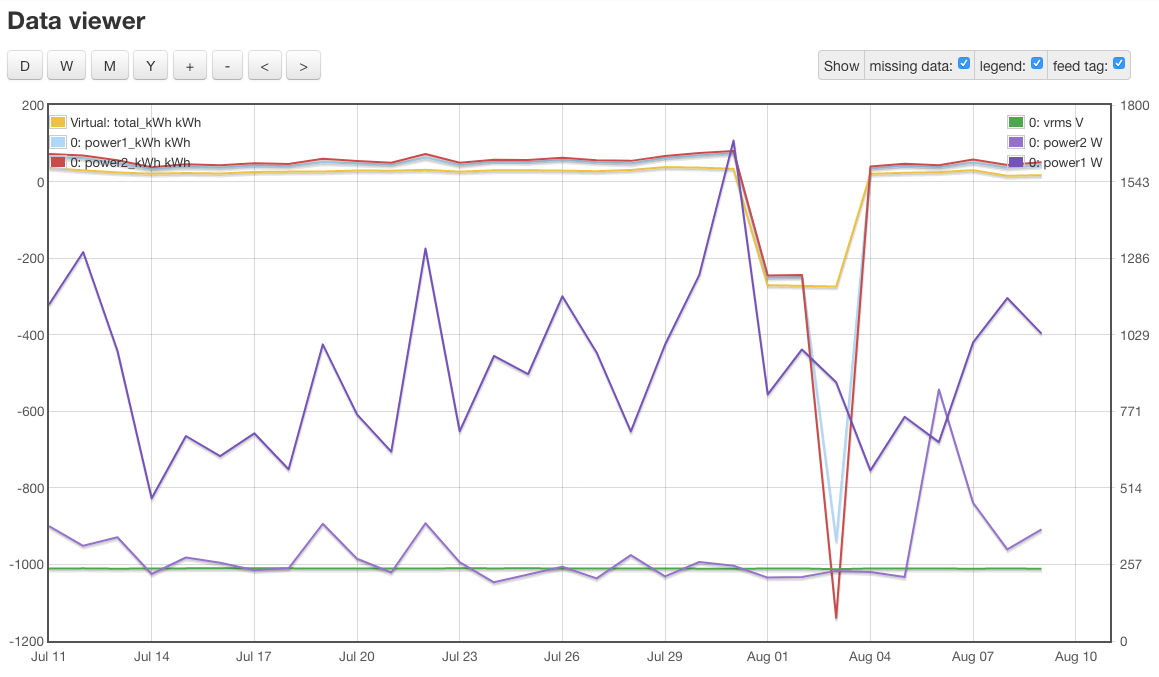
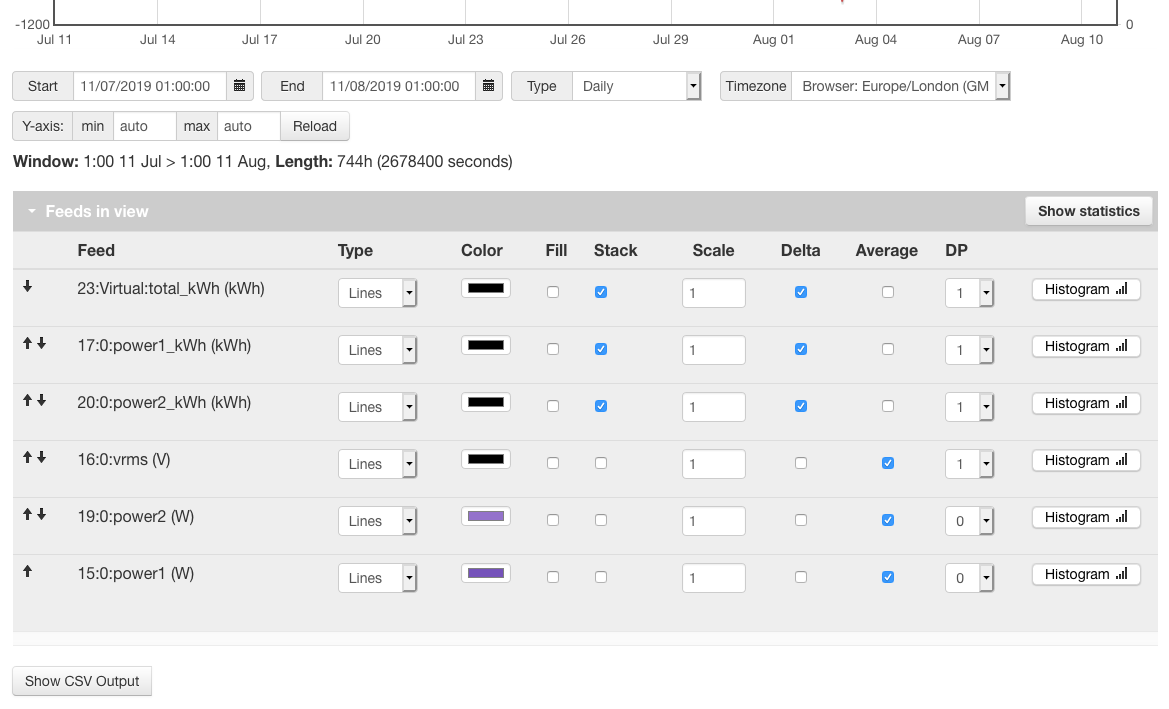
If you think it’s the virtual feed that is at fault you can easily put that to the test by creating a graph with 3 plots, power1_kwh and power2_kwh stacked and the virtual total_kwh plot should match(ish allowing for graph sampling differences).
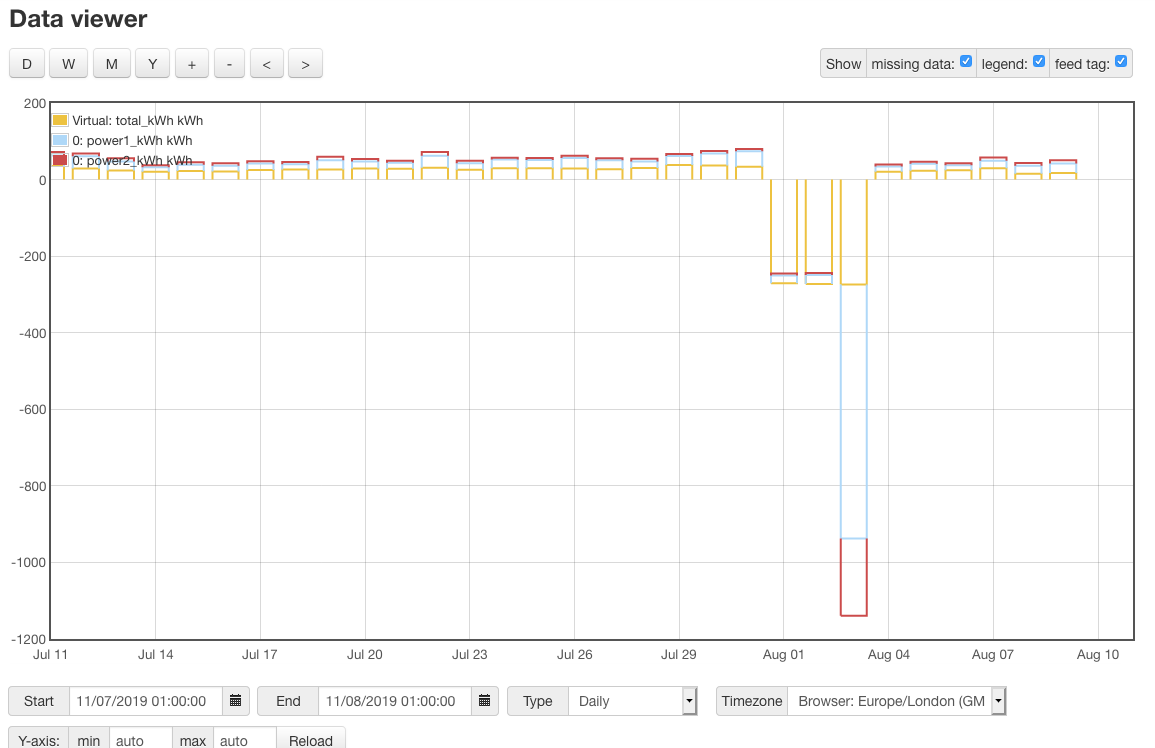
Can you post a screenshot of the above graph in 2 formats filled line and daily bar (for the same time period) ?
The first graph should show the total_kwh feed tracking the sum of the 2 raw kwh feeds and the second graph will demonstrate whether each day’s overall virtual total is equal to the sum of each of the 2 individual daily totals.
Although that first graph isn’t stacked as I suggested I think it is clear that the yollow trace is equal to the sum of the blue and red traces, so I’m not sure why you suspect there is anything wrong with the virtual feed. I can only sum the data that is available to it and it appears to have done that just fine in that first graph.
I asked for the same 3 feeds in daily bar form for the same period but you have just given us just the one, presumably based on the virtual feed? Without the source data to confirm if the result seen is credible or not we can only speculate as to the reason it’s not right.
Do the daily bar graphs for each of the source feeds look right or is the reset offset to the minus bars too?
Can you use the graph module for all comparisons please, when you compare data across different charts you cannot be sure your using the same yard stick.
That daily graph looks suspect regardless, a single reset would only show as a negative for one day, the next day would show an increase. And yes the correlation between the 3rd and the 1st is not right. it’s as if the 1st and 2nd are erroneous, the negative on the 3rd and the subsequent positive bars are believable.
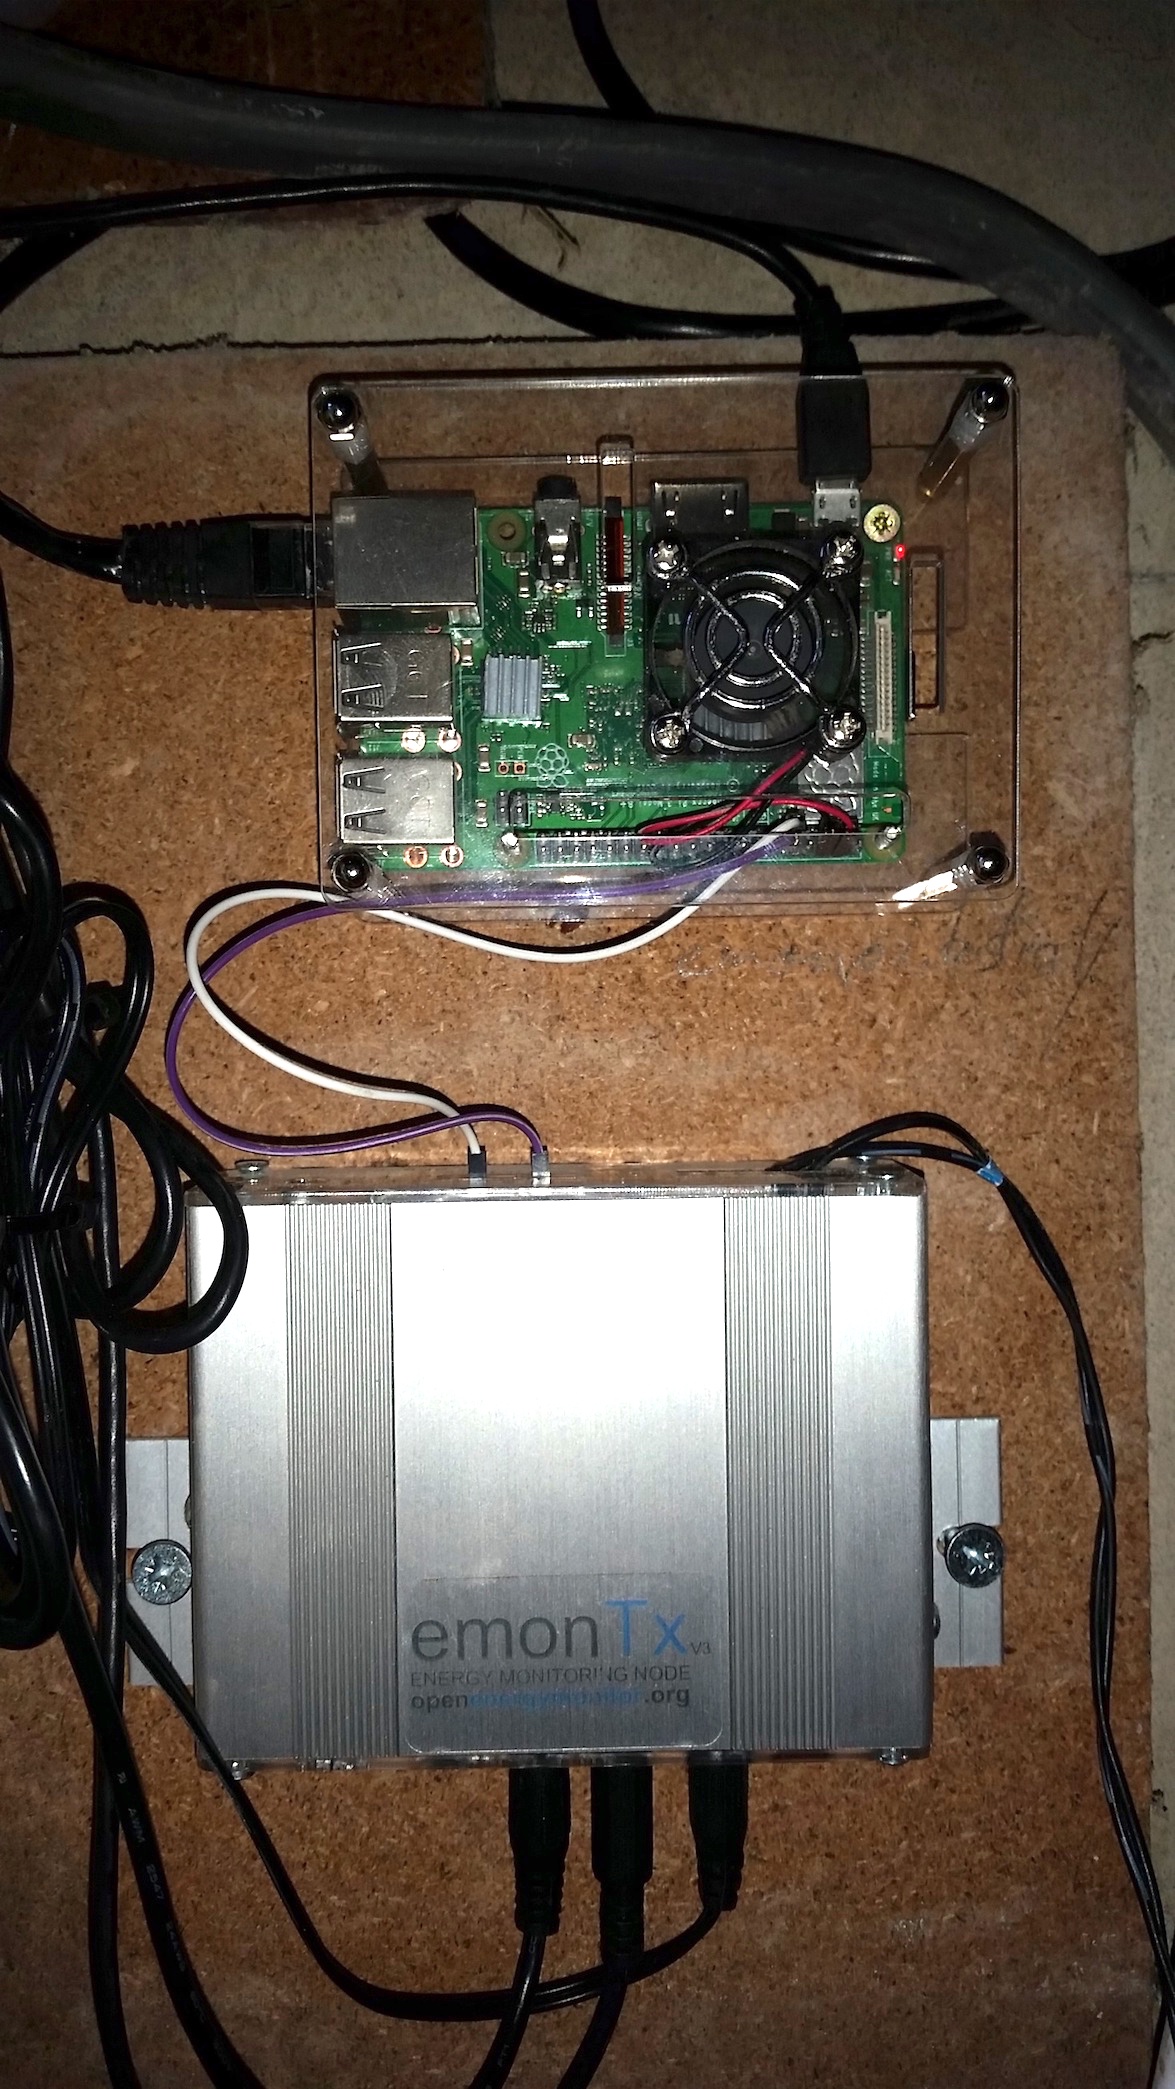
What are the source devices and their route to emoncms? If they are open to resets then you should be using a whaccumulator or pulse_count_to_pulse_increment processes to combat rollovers and resets.
Speculation is perfect actually. We need to speculate of why it’s showing these far-out negative values.
Perhaps the Delta function needs to be modified to only include positive deltas, ignoring the negative shift upon reset.
Randomly resetting feeds needs investigation… For example the question here is if the emonpi had been power-cycled, could that be a reason? Or is there something auto-updating that I’m unaware of?
The graph module shows the same error. Here’s a more detailed set of info:
The data comes in through emonHub, here’s the relevant part of the config file:
#######################################################################
#######################      emonhub.conf     #########################
#######################################################################
### emonHub configuration file, for info see documentation:
### https://github.com/openenergymonitor/emonhub/blob/emon-pi/conf/emonhub.conf
#######################################################################
#######################    emonHub  settings    #######################
#######################################################################

[hub]
### loglevel must be one of DEBUG, DEBUG, WARNING, ERROR, and CRITICAL
loglevel = DEBUG
### Uncomment this to also send to syslog
# use_syslog = yes
#######################################################################
#######################       Interfacers       #######################
#######################################################################

[interfacers]
### This interfacer manages the EmonTx3 ESP format serial
[[SerialTx3e]]
     Type = EmonHubTx3eInterfacer
      [[[init_settings]]]
           # Un-comment line below if using RS485 adapter
           #com_port = /dev/ttyRS485-0
           # default com port if using USB to UART adapter
           com_port= /dev/ttyAMA0
           com_baud = 115200
      [[[runtimesettings]]]
           pubchannels = ToEmonCMS,


[[MQTT]]

    Type = EmonHubMqttInterfacer
    [[[init_settings]]]
        mqtt_host = 127.0.0.1
        mqtt_port = 1883
        mqtt_user = emonpi
        mqtt_passwd = emonpimqtt2016

    [[[runtimesettings]]]
        pubchannels = ToRFM12,
        subchannels = ToEmonCMS,

        # emonhub/rx/10/values format
        # Use with emoncms Nodes module
        node_format_enable = 1
        node_format_basetopic = emonhub/

        # emon/emontx/power1 format - use with Emoncms MQTT input
        # http://github.com/emoncms/emoncms/blob/master/docs/RaspberryPi/MQTT.md
        nodevar_format_enable = 1
        nodevar_format_basetopic = emon/
and the emonTx runs official v3.1, wired in directly: