3 Phase Power – A Pragmatic Approach

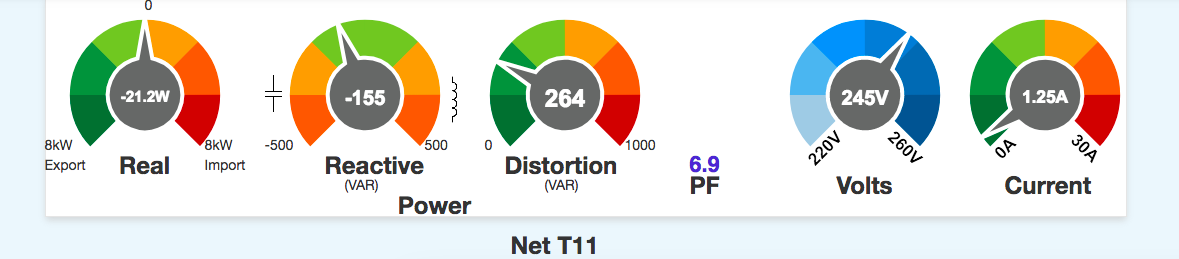
I’m monitoring a largish (30kWp) 3 phase PV installation with emonTx/Rpi’s running emonSD image Oct 2018. The emonTx at the incoming grid supply meter is running the v1.2 12 Mar 2018 firmware and I have made an attempt at calibrating it using an old electric kettle.

The grid supply meter is bog standard (not smart) and only records net total import across the 3 phases – eg: phase 1 importing 10kWh with Phases 2 & 3 each exporting 3kwh is recorded by the meter as a 4kWh chargeable import.

After several tests, I’ve established that the emonTx Pulse Count is precisely in sync with the meter reading – so Pulse Count is ‘revenue grade’ info as far as I’m concerned.

I’ve noticed that CHARGEABLE Import (total net import) as calculated from the 3 CT’s does not match the CHARGEABLE Import as recorded by the Pulse Count at the grid meter.

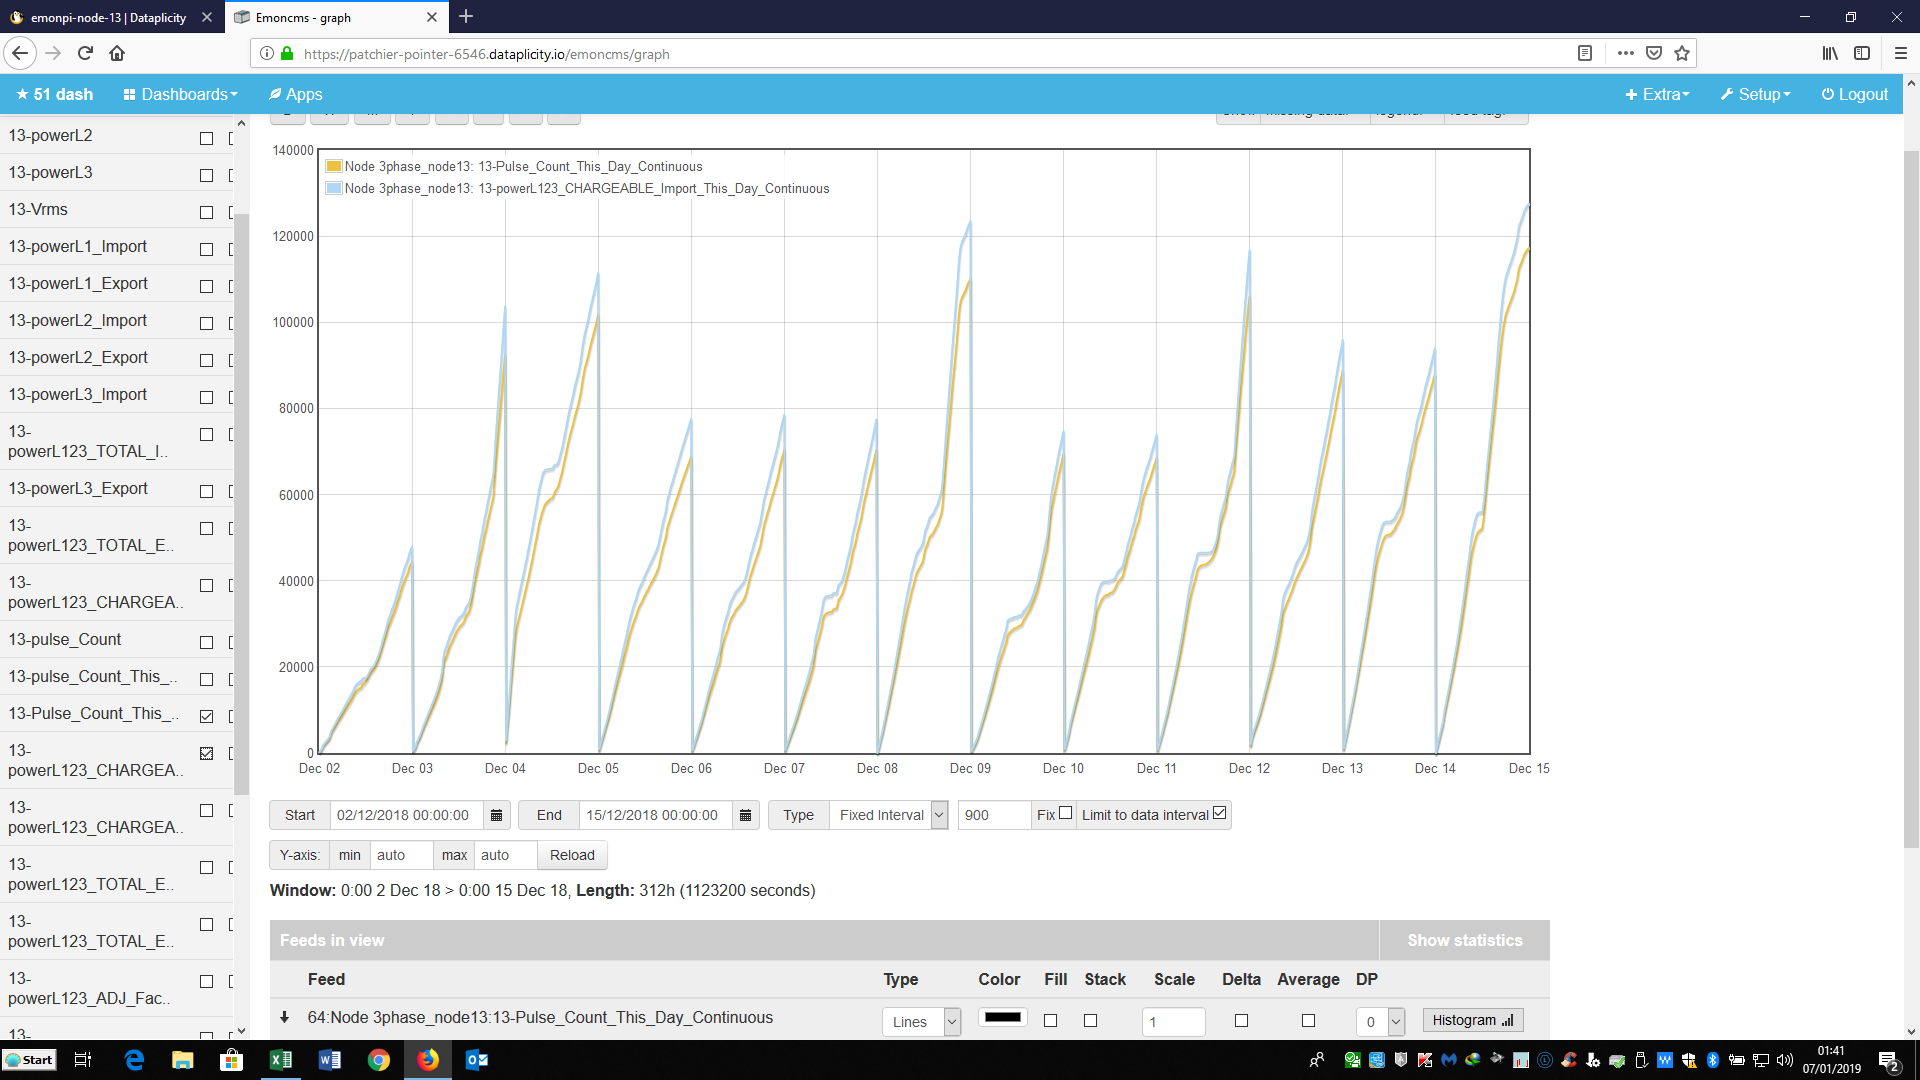
This is shown in the screen shot …

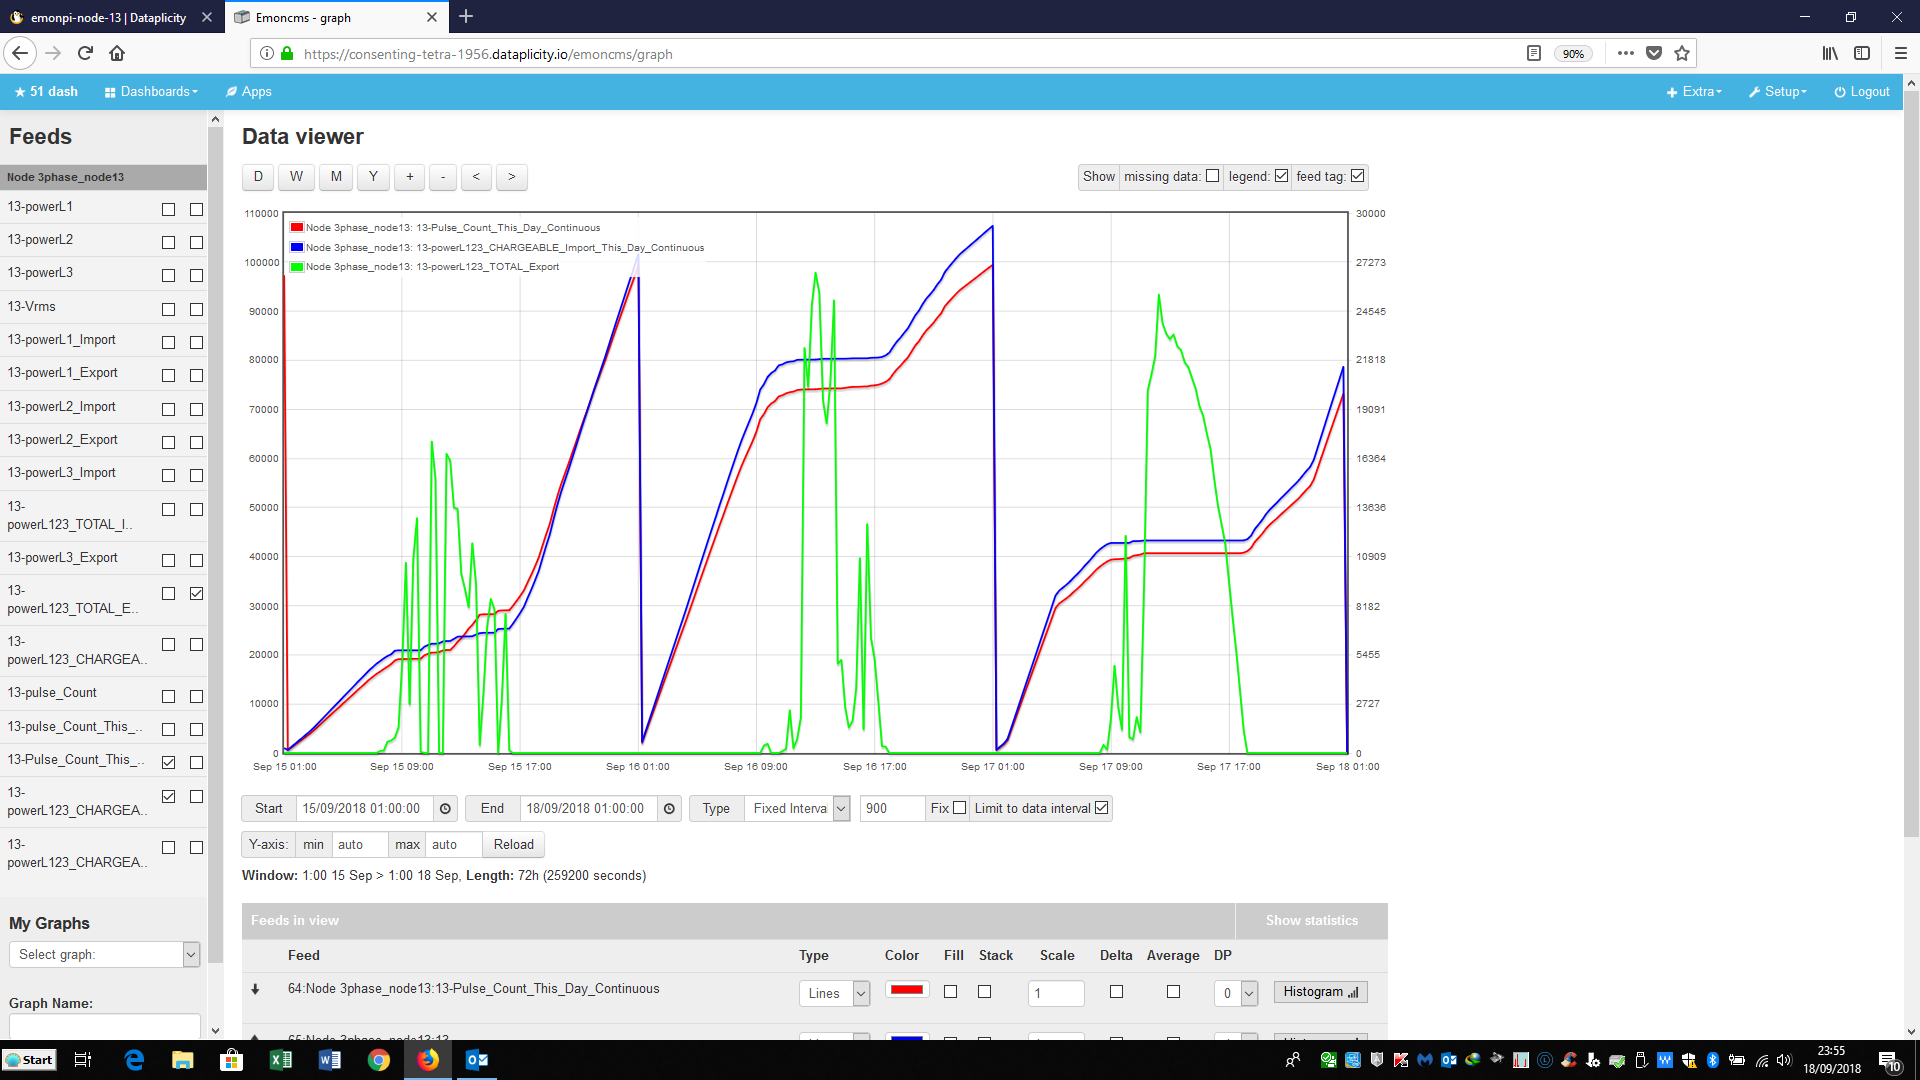
The red line shows chargeable import per the Pulse Count. The blue line is the chargeable import as recorded by the 3 CT’s. (And I accept that the difference is explained by calibration errors, component tolerances and the need to do 3 phase power calculations based on phase 1 voltage info only.)

As an observation, the greatest discrepancy occurs around the middle of the day when export (because of generation) occurs – the green line. But there is no obvious correlation between the amount of export and the size of the discrepancy.

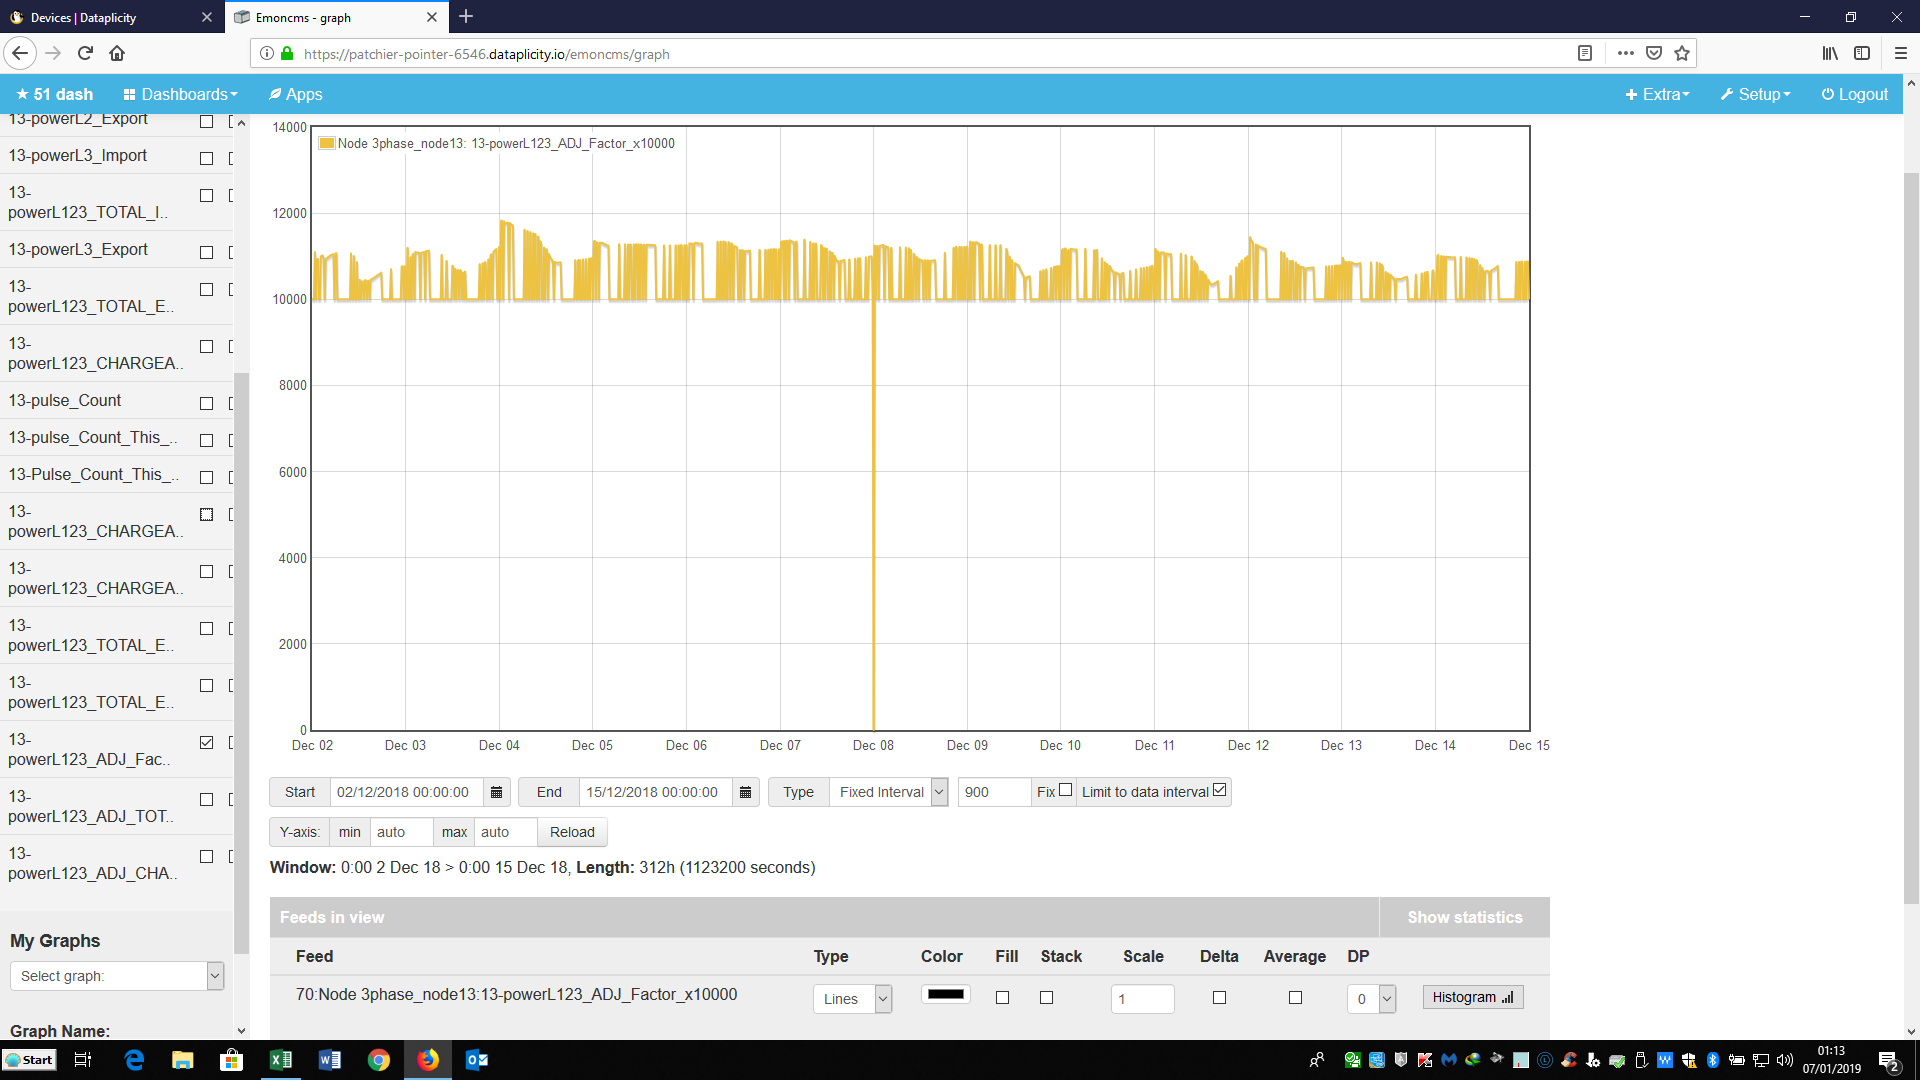
However, with some fiddly Input Processing, throughout the day I calculate an IMPORT ADJUSTMENT FACTOR between Pulse Count and chargeable import as recorded by the 3 CT’s.

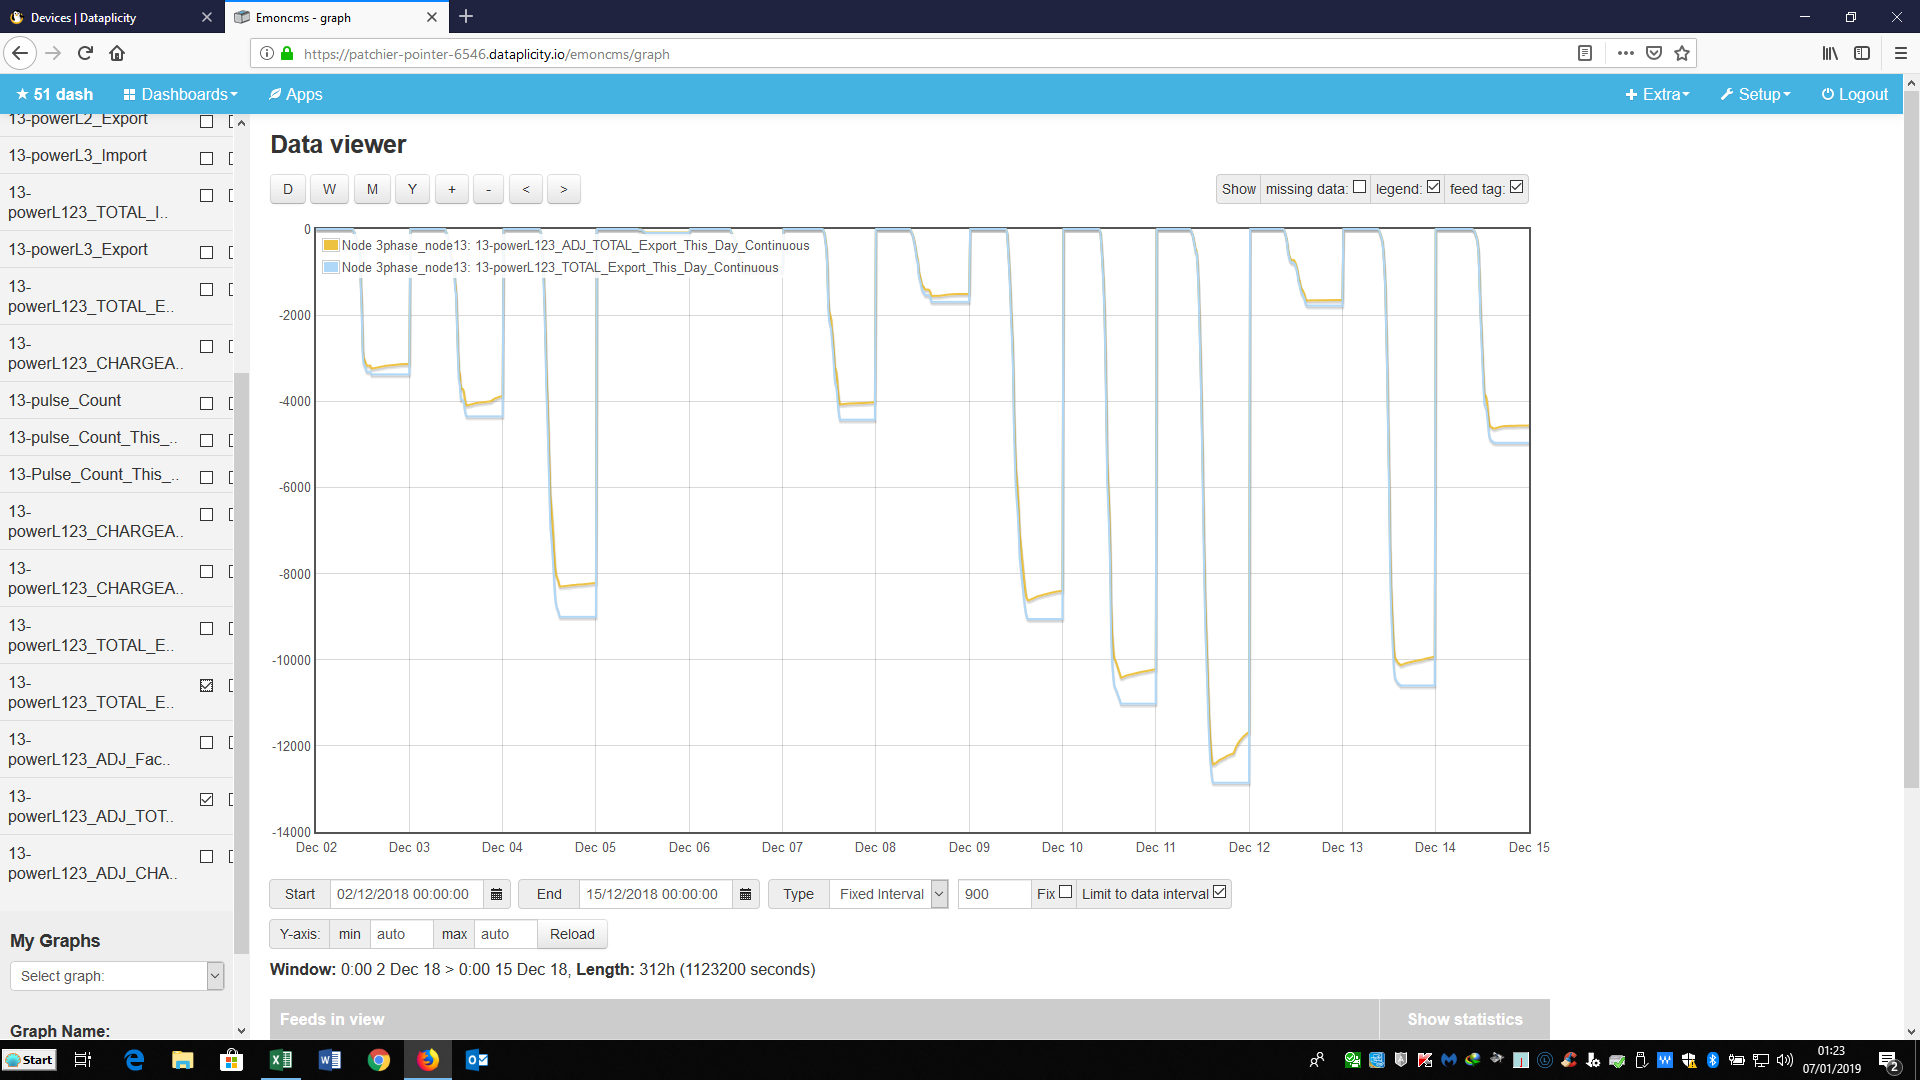
But what about export as recorded by the 3 CT’s? My pragmatic thinking is to apply this IMPORT ADJUSTMENT FACTOR also to export as recorded by the 3 CT’s. And I’m really only interested in daily totals rather than the minute by minute situation throughout the day.

Whilst calibration errors and component tolerances both affect import and export, I appreciate that phase voltage assumptions, power factor, etc may be quite different during export/generation.

Any comments or better/more pragmatic suggestions would be most welcome – thx.

I’m not sure I follow your thinking there. During that period, it appears that the red and blue lines are actually converging, while the rest of the time - when it’s mainly import - they are diverging.

Two thoughts:
1 - There’s a bias towards import in your emonTx. This could be due to noise being rectified and always appearing as positive power. (You could test this by reversing all 3 c.t’s and multiplying the power by -1).
2 - It’s a calibration problem with power factor, because it’s impossible to calibrate against phase errors over a very wide range of currents, because the phase errors of both the v.t. and particularly the c.t. vary over a range according to voltage and current, while the correction is fixed.

I think that could be because you’re only looking at the nett value over the 3 phases. It might show up if you separate them and look per phase.

Do you have any excess PV diverter technology?

If you do, that is designed to switch between import and export with the intention of not registering a pulse. The discrepancy shows how well your diverter is working, ie if the CT readings match the LED pulse, it’s not doing anything. I have several kWh “discrepancies” every day at this time of year.

Paul …

PV generation that is not used by the house is just exported.

The Pulse Count is recorded on the grid supply meter and the CT’s are clipped over the phase conductors at the grid supply meter. Sorry that I did not make that explicitly clear in my original post.

Robert is undoubtedly correct as to the reason for the difference …

Blockquote
2 - It’s a calibration problem with power factor, because it’s impossible to calibrate against phase errors over a very wide range of currents, because the phase errors of both the v.t. and particularly the c.t. vary over a range according to voltage and current, while the correction is fixed.

I interpret that as meaning that inevitably in the real life range of operation, the CT’s will not accurately reflect the actual import as seen by the grid supply meter - only the meter Pulse Count does that.

Given this as a fact - what does this imply for export as measured by CT’s at the meter and what can pragmatically be done about it? This was the basis/reason for my original post.

That long straight stretch from 1am to 9am on Sept 16 is an opportunity to get a rough handle on the error there. It’s looks like Blue is over-reading Red by about 8% there. BTW, is this some industrial/commercial site? It appears to have much larger consumption in the wee hours (8kW?) than in the evening peak.

It’s when they round the corner at around 9am that they really break away from each other, just as the PV starts producing. As the sun comes up, Red appears to notice net consumption go to 0 earlier than Blue. That time of near-balance is a very challenging time to correctly measure net flows. Any shortcuts taken (like only measuring one V) or any uncorrected phase errors can have a big impact during that period. My whole-house PF was less than 0.5 for over 30 minutes this morning as the sun came up through an overcast horizon. The inverter was roughly matching the load at the fundamental frequency, but wasn’t contributing anything to the harmonics, so plenty of current flowing but very little power.

What sort of load is that big 8kW that runs all through the wee hours? The answer to your basic question may depend a bit on that, and turning to that…

It’s hard to answer that, without first determining the cause of the errors you’re seeing.

EDIT - is your inverter connected to the internet? And if so can you get it to log your 3 phase voltages throughout the day? I’m no expert on emonTx accuracy, but I would have thought it could do better than 8% on an 8kW load especially after you had a shot at calibrating it. The nature of the loads, their spread across the phases, and the actual phase voltages recorded throughout the day might help narrow it down.

Actually, I think that might not be true, but I’ve yet to prove it. The reason I can say that is because the “phasecal” interpolation can be moved out of the sample loop and performed at reporting time on the entire sample, at that point the rms current and voltage is known, so it should be possible to use a look-up table to obtain more accurate values of the phase errors, so that they can be better compensated for.

@dBC and @Robert.Wall

It’s my son’s place - a large house in a rural location. The PV installation is 30kWp capacity. The panels & inverter are 100m from the grid supply meter at the house.

I had the screenshot for 15,16 & 17 Sep (my original post) on file and it well illustrated my point. However the first 2 days were not typical – the air source heat pump (7.5kW) which heats the pool did not turn off mid-afternoon as usual – suspect my son was fiddling with the thermostat.

The following graph is more typical – 2 to 14 Dec. The blue line is chargeable import per the pulse count and the orange line is total chargeable import per the CT’s. A pretty consistent pattern day to day with a discrepancy of 10% or less. The high load days are when the electric car was being charged (usually after sunset).

My Input Processing calculates a percentage correction progressively from the start of each day. For convenience this is multiplied by 10000. This is what it looked like …

My Input Processing applies this same correction factor to total export as calculated from the CT’s – a pragmatic/simplistic approach?

My thinking and I take your comments to mean … finding the reason for the discrepancy will not be easy, the solution(s) may be difficult and only provide a partial answer which itself could need correcting by a factor albeit smaller than now.

This is what happens to export - with the blue line showing total export per the CT’s whereas the orange line is total export ADJUSTED by the factor.

And the reason for all this? … to produce a daily/weekly/monthly report in this format …

Per Day kWh %
GENERATION Total 101.2 100.0%
Self Consumption 50.4 49.8%
Export 50.8 50.2%
USAGE Total 134.3 100.0%
Self Consumption 50.4 37.5%
Import 83.9 62.5%

Generation and Import are from pulse counts at the Inverter Smart Gen meter and the Grid Supply meter respectively. Export is what this Forum post is about. Self Consumption is a matter of arithmetic and to the extent that Export is in error, Self Consumption will be similarly in error.

Early on, you wrote

How exactly did you do that? Did you attempt the full calibration as per the instructions, and at what current did you do it - I’m guessing about 10 A. That’s at the low end of your average consumption, which appears to go from about 1.6 kW ( say 7 A) to about 10 kW (say 42 A). But although it’s right on the bottom end of the specified accuracy range for the SCT-013-000, it should still be reasonably good (though I tend to use 5 A and 6 turns through the c.t. to read 30 A).

What I’m struggling to understand is the mysterious correction factor that you’re applying. To me it looks as if the days when the correction is smallest are the days when the pulse count and integrated Wh best match, so I read that as meaning that the supposed correction is actually making it worse.

In terms of amplitude, there’s no inherent reason why import and export should be different to any significant degree. We expect a very small contribution from noise - but as that is random in nature, it tends to cancel out over the measurement period, and what little does get rectified by the maths is in the order of tens of milliamps.

The possible big difference between import and export comes with power factor. When exporting, the load is the grid, and the last time I heard a value for that, it was about 0.9 inductive. The power factor when importing is that of your son’s house, and what that will be will depend on what is being used at any instant.

Setting the phase calibration is inherently imprecise because the peak power (factor) is ill-defined. I’m tempted to suggest trying to recalibrate the phase for the reference channel (only). This time, take the reference channel (the c.t. that is on the same phase as the reference voltage) and move the c.t. and the kettle onto a different phase, so that you’re adjusting to show a power factor of -0.5 rather than 1.0. That should give a much better defined aiming point. If it’s -0.5 before you change anything, it was right to begin with and sorry for wasting your time. But that’s the best idea I can come up with at the moment.

Robert …

In my old kettle test, the CT was clipped over one conductor only. My clamp meter read approx. 11A – so close to yr 10A estimate.

As an aside – I found the calibration process frustrating. platformIO didn’t work for me (had become way too complicated) and Arduino IDE changed their software (remember the Forum exchange we had on that 5 or so months ago?). So I thought – why make corrections within the Arduino? – why not make them instead in the subsequent emoncms Input Processing?

And as an even more extraneous aside – over 2 years, with 4 x emonTx/RPi’s, in 2 locations & on many occasions – I’ve always found that Vrms was reported as 4/5 volts higher than I recorded by other means.

My ‘mysterious’ correction factor is quite simple …

Import per CT’s to that point in the day divided by the pulse count to that same point in the day – which I multiply by 10000 for convenience.

Then this correction factor is logged to a feed in the same Input Processing cycle.

So clearly, the closer CT’s and pulse count are – the closer the correction factor will be to unity (10000). And, the closer to unity, the smaller will be the correction.

The correction factor goes back to unity at the beginning of each day.

The last step in the Input Processing cycle is to apply this correction factor to the total export per the CT’s at that same point in the day.

The correction factor is calculated from the running cumulative totals of import. I could have calculated a correction factor for each phase individually. But as my current Import Processing already has 56 steps, I thought that would be OTT.

My current thinking is … Correcting import per CT’s to import per pulse count is surely not open to questioning – the meter is the ultimate authority. However, from this forum discussion, I’ve learned that applying the import correction factor to export may be open to questioning. Power factor will be different importing as opposed to exporting. Likely my son’s power factor will vary during the day and from day to day. And I do know that his phase loads are not balanced. Whether this justifies having an export meter fitted – I’m not sure.

Many thanks for all your inputs.

That’s an interesting statistic I’d not considered before. Is that a grid wide average or is that what most inverters are likely to see most of the time? Do you know whether it’s dominated by the transmission network or by local loads in the 'hood?

As it was way before private generation with PV became commonplace, it undoubtedly referred to what a power station saw as its load. It was also way before switched-mode power supplies became commonplace, so it could well be wrong now.

The CT on the output of my inverter does see the world as slightly inductive:

But I guess that’s after the inverter’s own power supply has taken what it needs. So if you consider the CT facing the world, then behind it is a generator (the inverter) and probably a SMPS to run the inverter.

Never having been involved at all with the generation or distribution side of things, I don’t have anything more than a very scant knowledge of this side of things.

@dBC

That’s impressively clear data.

Do you have similar data from CT’s at your grid supply meter?
What does it look like when you are importing?
What does it look like when you are net exporting (after self-consumption, that is)?

I assume that you are single phase.

I found this on our very own Forum …

https://openenergymonitor.org/forum-archive/node/667.html

May be of interest …

I understand some inverters might also control power factor, in much the same way as I understand they can fill in harmonics on the supply. As I say, I don’t know the mechanism, I guess (for p.f.) some means of circulating VArs under control is involved.

Yes, the new standards here require they produce reactive power under various conditions, although mine pre-dates that regulation.

@johnbanks Here’s what the CT at my whole-house meter looks like when it’s near balance which is what’s being described in your pointer, and what I was trying to describe in a post above about very low whole-house PFs for over 30 minutes:

You can see there’s almost no power flowing, but plenty of current, and it’s mostly in the harmonics. In something this distorted apparent power is very much a 3D vector:

21^2 + 155^2 + 264^2 = (245x1.25)^2

(and yes, my place is single phase).