The higher dT that I get is actually a problem for me, because it makes the return temp rise higher than I want it to, because the radiators can’t emit the heat fast enough. I can only get steady state at higher flow temps. This is why I was experimenting with higher pump speed, hoping that I could then run cooler, but I had complaints about the increased noise.
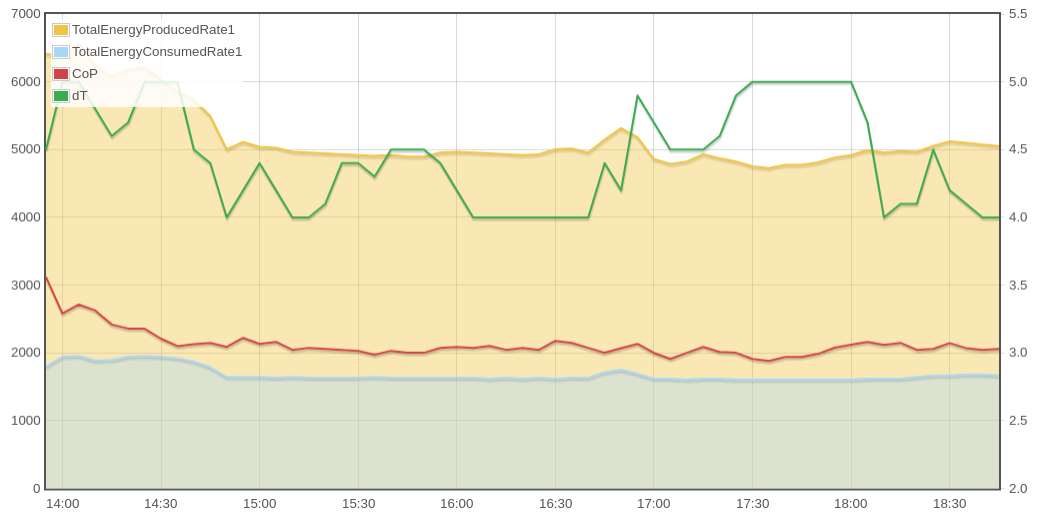
The Experiment: while the heat pump was in a steady state, I changed the pump speed to see what would change. Chart below shows averaged data over 5 minute periods, for electric consumption (blue), heat produced (yellow), COP (red) and dT (green).
Most of the afternoon was running at 16 l/min until about 16:30, with a dT between 4 and 4.5.
Between 17:00 and 18:00 I dropped the speed down to 14 l/min (how I usually run), and the dT increased to 5. There’s a slight dip in heat output and COP, with the input barely changed at all.
At 18:00 the speed was increased back to 16 l/min, and dT reverted to it’s previous level. Return temp (not shown) was a steady 35.5 throughout. I could perhaps done with leaving it running at the slow speed for a bit longer, as heat output looked to have maybe recovered towards then end of that hour.
(should probably have started a new post for this, but it’s already spread over 3 discussions)
I’d say this highlights that there are many factors affecting the performance of the whole heating system, not just temps and speeds a heat pump.
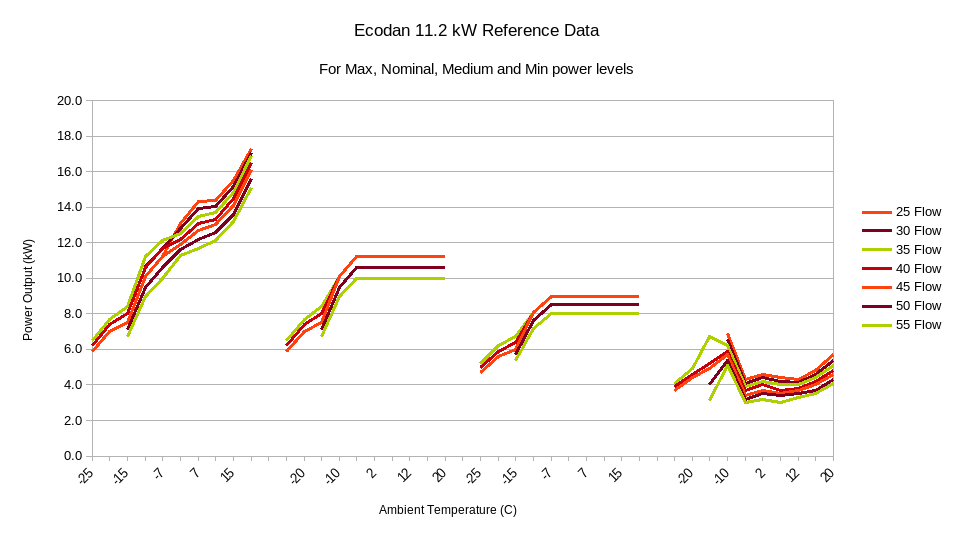
And for completeness, because I have it to hand, here’s the same but showing Power Output. This matters for me because my house requires 6 kW or less, so heat pump is running on Min power most of the time.
I have commented on other posts before about differentials between systems and why we can’t use it as a set in stone this is what it should be.
The only thing in common on this thread is that two people are using the same heat source and from that point on there are way too many variables that can have an effect on the data you are looking at.
Although all data has some interest to observers as an installer it’s a nightmare when these stats are produced with clients expecting (demanding in some cases that we match the best result) without or little knowledge of how it all works and what can effect them. Once you have your system to a point of comfort/cost balance that you are happy with you then have to decide if it is worth chasing minute variables to gain anything.
I’ve started adjusting the weather compensation curve and just used the overall control to move the curve -4 on the FTC5 controller.
House has maintained at a steady 18 degrees all day, however I’ve noticed that the fan is turning off and on about every 15mins. Pumps still appear to be running when the fan is off.
I’m guessing (looking at the data below) to that the flow temp is going above the temp that the weather curve is set too and the fan is shutting down? Is this because the rads aren’t losing enough heat?
Yes, this is known as “cycling”, and is what heat pumps do when they can’t modulate low enough. It’s quite normal, and 30 minute cycles isn’t anything to worry about. Opening up some radiator valves can help shed some of that heat into the house. Turning up the flow temp slightly can get it into a steady state, but it’s hard to say if COP will be better or worse.
Nah, it’s well within the manufacturers specification. Turning on/off every 2 minutes would not be good, but 2 or 3 times per hour is fine. The Mitsubishi has a minimum run time of 20 minutes anyway.
I would recommend having all radiators as open as possible, at both ends. Heat Geek has a video on why not to zone heat pumps.
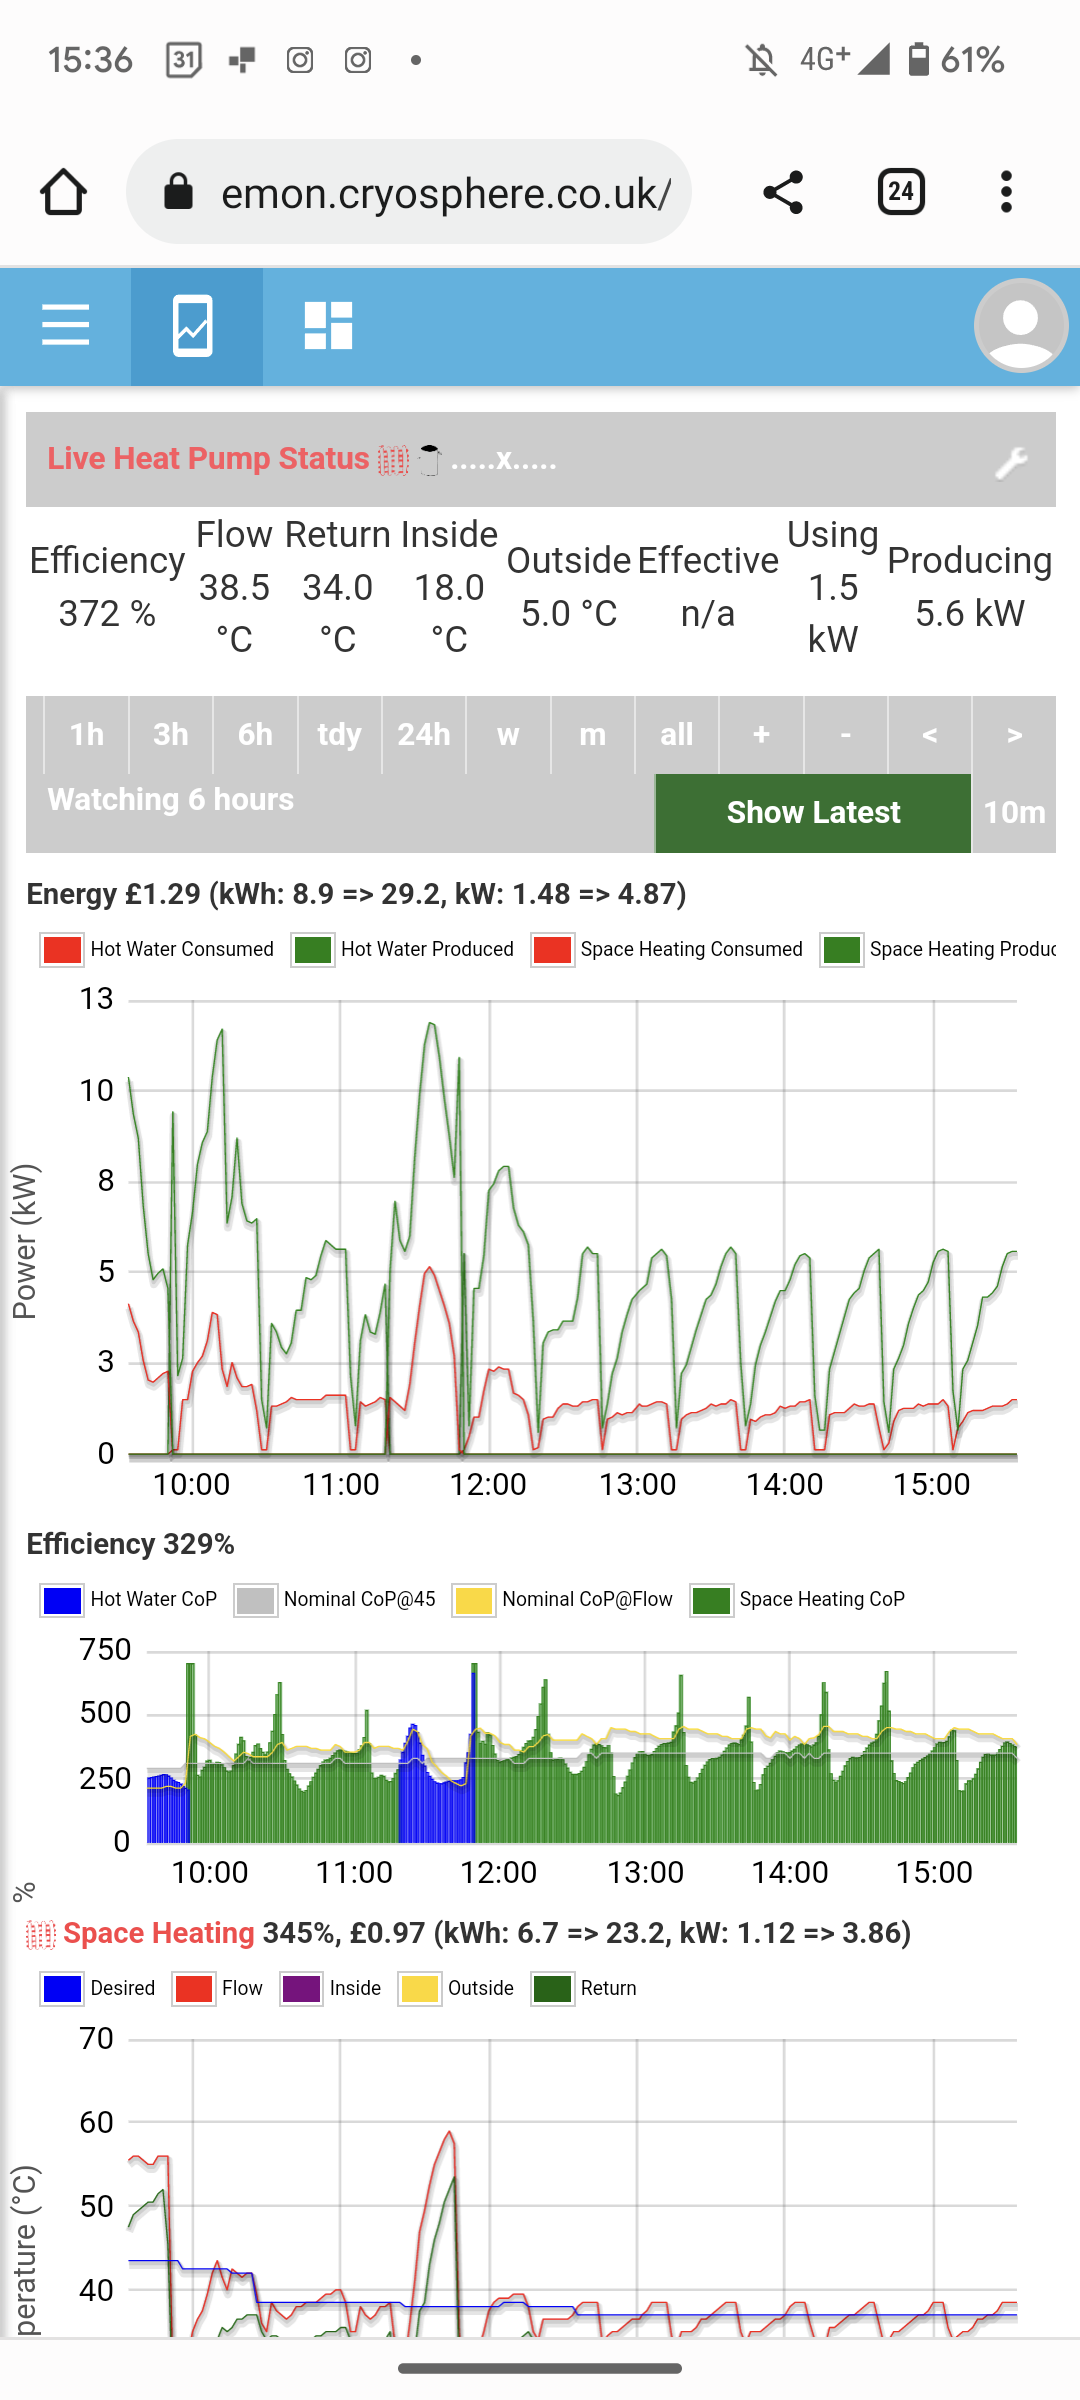
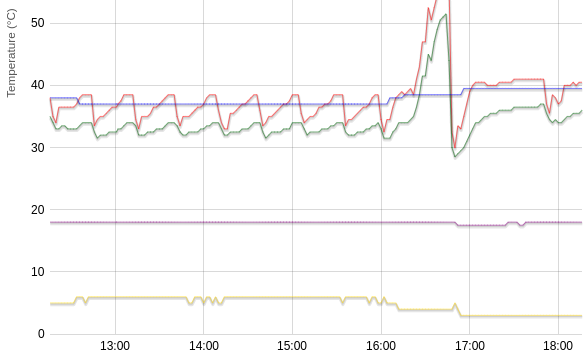
Zooming in on the data: can see it cycling through the afternoon as flow (red) goes above the weather compensation (blue). After 17:00, the outdoor temperature drops from 6 to 3C, WC goes up to 40C and heat pump manages a nice hour-long run. COP is more or less the same, at about 3.33.
So I’ve been playing with the weather compensation curve and getting much better COP and house temperature stable at around 19 degrees.
WC set at 47C@ -3 and 27@ 20.
I’ve left target room temp stable over night (no setback)and I’m seeing cycling and heat pump (I think) - hitting the target temp and turning off (both on flow and on room stat). Would anyone be able to look at the data and decode - overnight data going into this morning 13th March - different pattern of cycling to last night - still ok?
Possibly better. Generally more cycling is bad, but it might be what you are after. Certainly doesn’t look like bad cycling. Just checking it wasn’t a typo
The cycling of your system overnight looks normal and as per design, taking just 2.9 kWh to generate 13.3 kWh of heat (COP = 4.6). The only thing you can do better is to program in a 2C “setback” of room temperature overnight, though I’m not sure that’s possible with Ecodan controls.
Overall, performance is comparable. Your system has a wider range of COPs, often better than mine, but spends more time at higher flow temperatures where COP isn’t as good.
I still haven’t really played with my weather compensation curve. I’m just learning how the house reacts with blunt adjustments on the main curve at the moment - sat with -3 taken off the whole curve. At colder temperatures the house was stable at 18C (intended temp) but felt cold at times.
If you had no buffer/header, or a heat meter installed on the radiator side of your existing buffer/header, you could check to see that the flow/return from the radiators, at a given power output (to the house), matched what it ought to be.
Any discrepancy there will be due to radiator balancing / blocking issues. This will increase the flow temperature required to put a certain amount of heat into the property; thereby moving you into a less favourable part of the performance envelope of the heat pump.
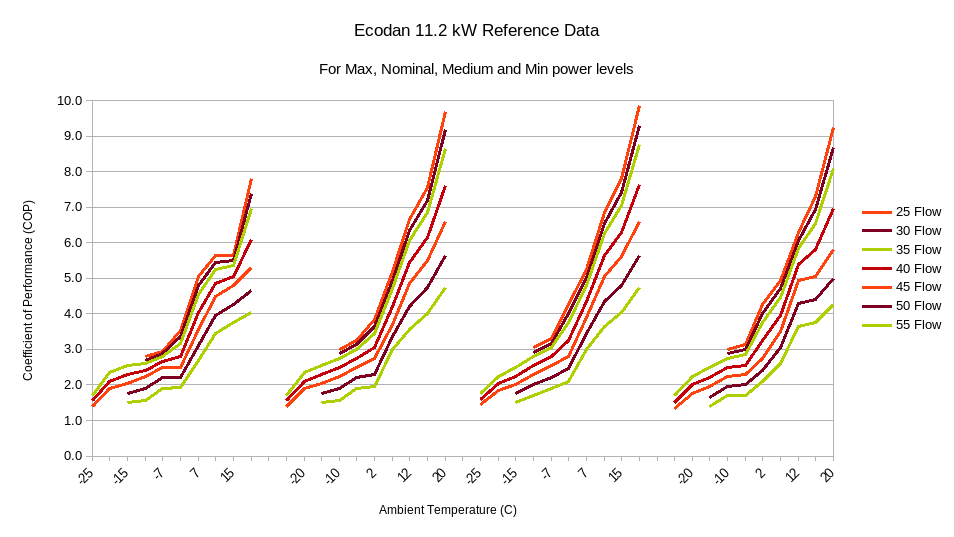
A more useful chart for comparing would be 3D. Flow temp vs outside temperature vs COP.