A few to start with, variation between units is high.
One issue that may or may not be significant is that we are using MetOffice outside temperature data and while in general agreement is good, especially for longer term averages, looking at the precise outside conditions over x number defrosts some of the variation seen here could reflect deviations in the actual evaporator air in temperature. This is something we want to look at in more detail and perhaps provide the option for a direct outside temperature measurement at the back of the unit as standard.
These are all 7 kW Vaillant Arotherm’s (scroll to the right to see dashboard link):
| System ID | OutsideT | Peak FlowT | Mean FlowT | Flow rate | Peak elec | Mean elec | Peak output | Mean output | Datasheet | Missing W | Missing | Cycles | Dashboard link |
|---|---|---|---|---|---|---|---|---|---|---|---|---|---|
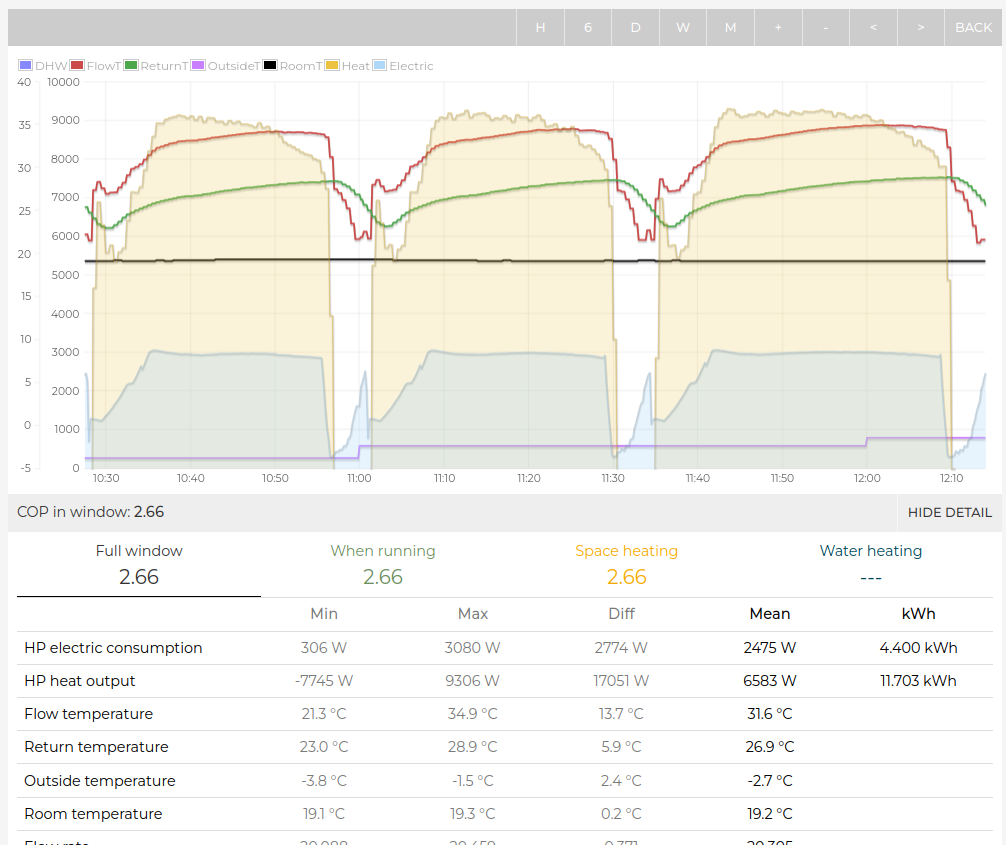
| 510 | -2.7 | 34.9 | 31.6 | 20.3 | 3080 | 2475 | 9306 | 6583 | 8800 | 2217 | 25% | 3 | Emoncms - app view |
| 510 | -3.2 | 35.1 | 31.9 | 20.3 | 3131 | 2451 | 9305 | 6385 | 8800 | 2415 | 27% | 3 | Emoncms - app view |
| 510 | -0.3 | 36.1 | 33.3 | 20.3 | 3224 | 2543 | 9636 | 6712 | 9500 | 2788 | 29% | 3 | Emoncms - app view |
| 124 | 0.1 | 34 | 31.9 | 24.6 | 2734 | 2099 | 11470 | 7727 | 9500 | 1773 | 19% | 4 | Emoncms - app view |
| 124 | -0.1 | 34.4 | 32.3 | 24.5 | 2980 | 2474 | 12442 | 8290 | 9500 | 1210 | 13% | 3 | Emoncms - app view |
| 282 | -2.8 | 37.4 | 35.7 | 20.3 | 3229 | 2778 | 10071 | 7391 | 8800 | 1409 | 16% | 4 | Emoncms - app view |
| n/a | -0.7 | 38.5 | 36 | 20.2 | 3033 | 2528 | 8600 | 5675 | 9200 | 3525 | 38% | 3 | Emoncms - app view |
| 284 | -2 | 39.2 | 36.5 | 20 | 3216 | 2589 | 8917 | 5936 | 8800 | 2864 | 33% | 4 | Emoncms - app view |
| 284 | -0.2 | 37.6 | 34.4 | 20.7 | 3148 | 2534 | 10249 | 6413 | 9400 | 2987 | 32% | 3 | Emoncms - app view |
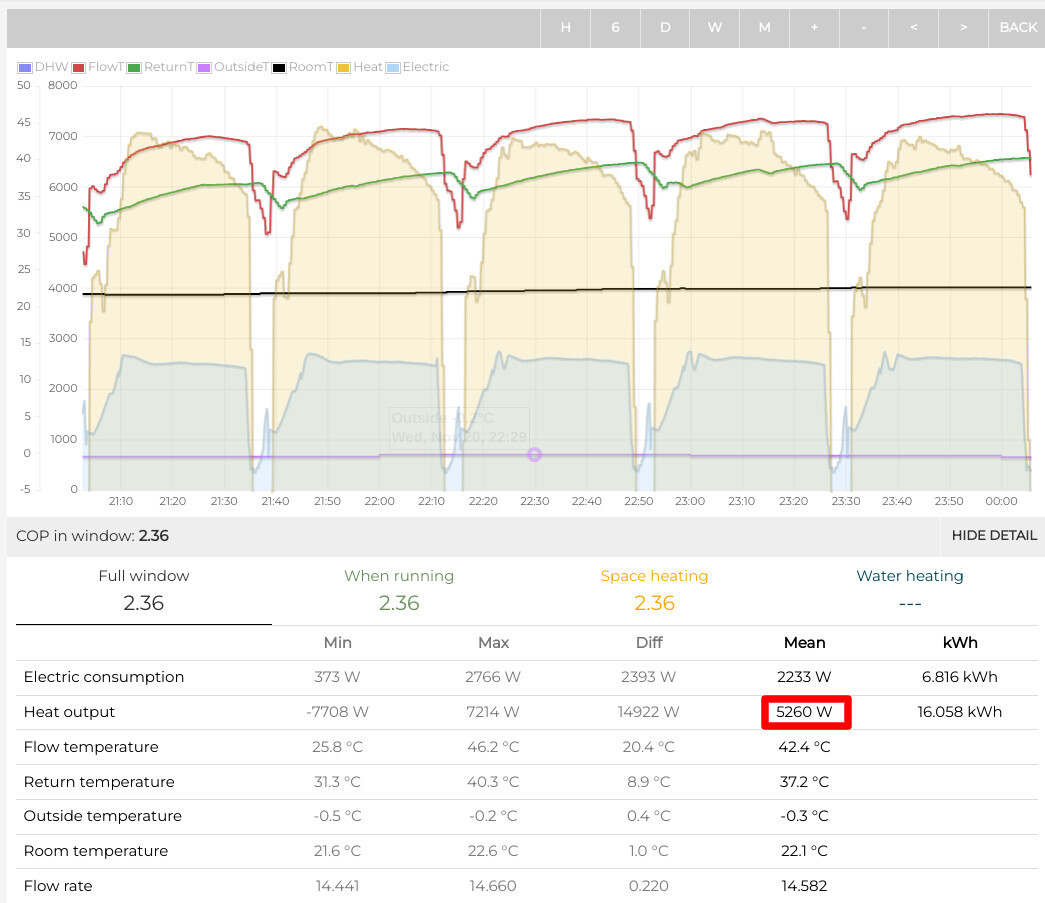
| 315 | -0.9 | 47.9 | 43.9 | 20.2 | 3503 | 2939 | 8582 | 6239 | 9000 | 2761 | 31% | 5 | Emoncms - app view |
| 258 | 0 | 34.9 | 31.8 | 19.9 | 3166 | 2458 | 9556 | 6512 | 9500 | 2988 | 31% | 3 | Emoncms - app view |
| 517 | -3.2 | 46 | 43 | 20 | 3484 | 3054 | 8315 | 6925 | 9000 | 2075 | 23% | 2 | Emoncms - app view |
| 392 | -1.6 | 36.2 | 32.2 | 20.7 | 3087 | 2408 | 9461 | 6292 | 9100 | 2808 | 31% | 4 | Emoncms - app view |
One of the things we have to be careful with when taking max output measurements is that the unit is really trying to run at max output and that the compressor is not modulating down due to flow temps reaching near the WC flow target. E.g @glyn.hudson set his WC curve to target 90C flow temp at 0C outside to be sure it would try and go to max. Most of the systems here wont be specifically doing that extreme of a test but their compressor electrical consumption curves are very similar indicating that they are not quite meeting their curve target temperatures anyway.
E.g Glyn’s test, we see a characteristic shape here, there’s that peak electric consumption above 8 mins in, then a very slight reduction followed by a flattish period and then a slight curve downwards towards the end.
The same is visible in system id 124 example 1 Emoncms - app view. Are we therefore happy that this period reflects the maximum compressor output? We do see some variation in both the peak and mean electrical consumption for the above examples, some of this is variation in full cycle period length and length of the defrost period itself, providing slightly different duty cycles.