is it possible they are crashing at the same time each day?
When did you last update the emonSD?
Were you definitely fully logged out? 35mins after posting you started a new test you posted that you had some strange behaviour when setting feeds to public, which you must be logged in for.
Can you open a incognito browser window and enter that url again and leave that incognito browser open to see what happens, are you testing this on a PC that is permanently awake? It’s ok for the screen to sleep, but if the PC sleeps it will interrupt the connection and need a reload.
I’m not overly familiar with firefox or keeping an android device connected to a page for a prolonged time. I use chrome. Do you have chrome you can test with?
The reason I say above to use incognito mode is because (with chrome, not sure about FF or android) a chrome user status is common to all chrome windows opened by that user, you cannot be logged out in one window whilst logged in in another window unless they are as different chrome users. an incognito window helps keeps things separate.
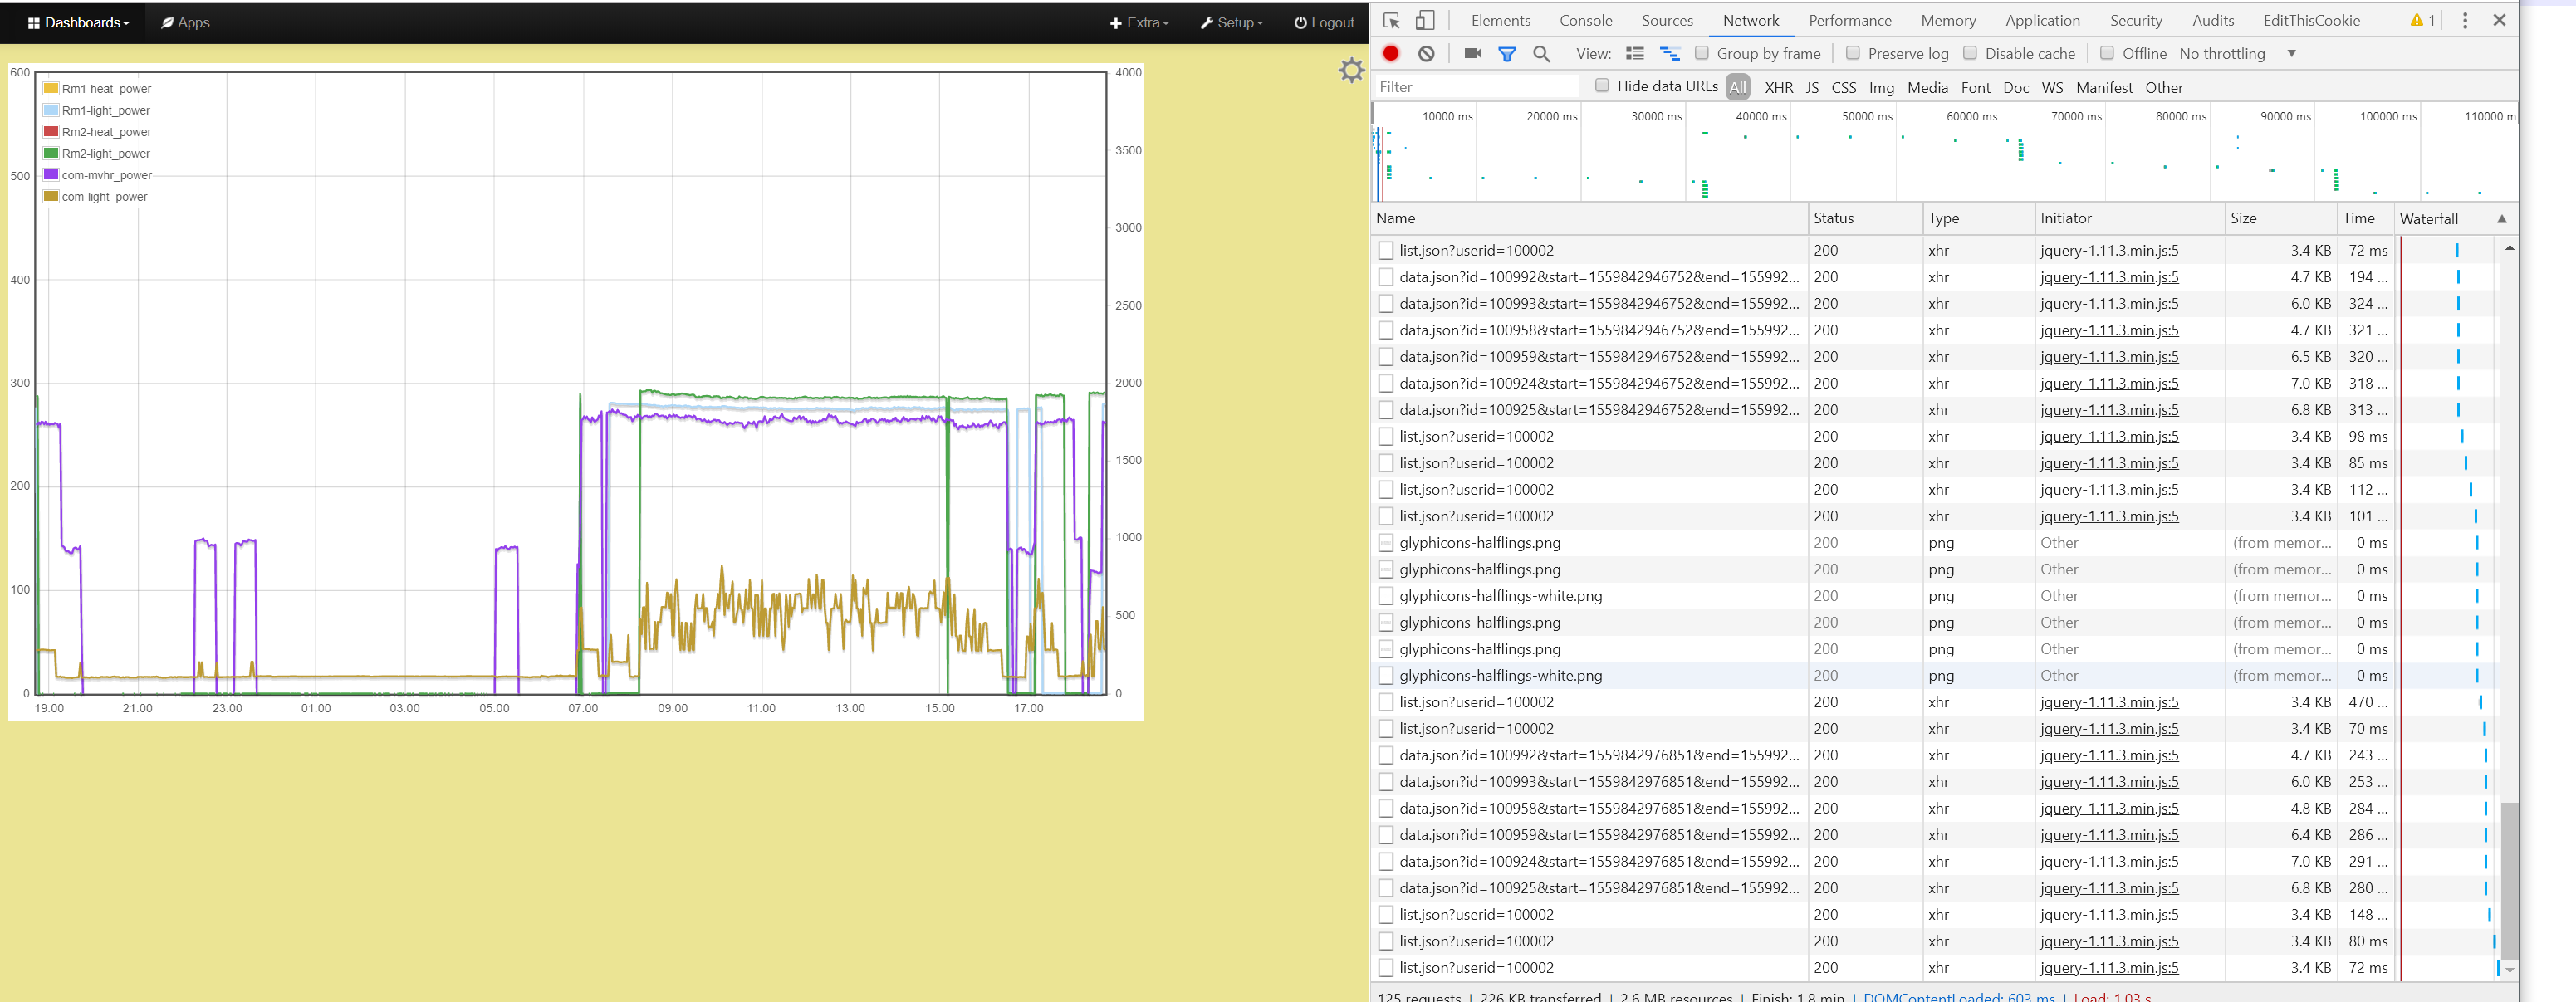
Something else you could try is opening the developers console (F12 on chrome) and have that running so that you can see the regular data update requests
in the image above each of those data.json?id=100xxx&start… lines is a data request, one for each trace of the graph, each block of 6 requests happens every 30s (multigraph refresh setting)
You can also tail the apache access.log in a separate ssh terminal window
sudo tail -f /var/log/apache2/access.log
here are a couple of lines from the same site and page as the above example (some details fudged)
123.123.123.123 - - [07/Jun/2019:18:49:03 +0100] "GET /feed/data.json?id=100992&start=1559843342708&end=1559929742708&interval=108&skipmissing=1&limitinterval=1&apikey=abcd1234abcd1234abcd1234abcd1234 HTTP/1.1" 200 4841 "https://myserver.com/vis/multigraph?embed=1&mid=100018" "Mozilla/5.0 (Windows NT 10.0; Win64; x64) AppleWebKit/537.36 (KHTML, like Gecko) Chrome/74.0.3729.169 Safari/537.36"
123.123.123.123 - - [07/Jun/2019:18:49:03 +0100] "GET /feed/data.json?id=100993&start=1559843342708&end=1559929742708&interval=108&skipmissing=1&limitinterval=1&apikey=abcd1234abcd1234abcd1234abcd1234 HTTP/1.1" 200 6470 "https://myserver.com/vis/multigraph?embed=1&mid=100018" "Mozilla/5.0 (Windows NT 10.0; Win64; x64) AppleWebKit/537.36 (KHTML, like Gecko) Chrome/74.0.3729.169 Safari/537.36"
123.123.123.123 - - [07/Jun/2019:18:49:03 +0100] "GET /feed/data.json?id=100959&start=1559843342708&end=1559929742708&interval=108&skipmissing=1&limitinterval=1&apikey=abcd1234abcd1234abcd1234abcd1234 HTTP/1.1" 200 6846 "https://myserver.com/vis/multigraph?embed=1&mid=100018" "Mozilla/5.0 (Windows NT 10.0; Win64; x64) AppleWebKit/537.36 (KHTML, like Gecko) Chrome/74.0.3729.169 Safari/537.36"
123.123.123.123 - - [07/Jun/2019:18:49:03 +0100] "GET /feed/data.json?id=100924&start=1559843342708&end=1559929742708&interval=108&skipmissing=1&limitinterval=1&apikey=abcd1234abcd1234abcd1234abcd1234 HTTP/1.1" 200 7442 "https://myserver.com/vis/multigraph?embed=1&mid=100018" "Mozilla/5.0 (Windows NT 10.0; Win64; x64) AppleWebKit/537.36 (KHTML, like Gecko) Chrome/74.0.3729.169 Safari/537.36"
123.123.123.123 - - [07/Jun/2019:18:49:03 +0100] "GET /feed/data.json?id=100958&start=1559843342708&end=1559929742708&interval=108&skipmissing=1&limitinterval=1&apikey=abcd1234abcd1234abcd1234abcd1234 HTTP/1.1" 200 5121 "https://myserver.com/vis/multigraph?embed=1&mid=100018" "Mozilla/5.0 (Windows NT 10.0; Win64; x64) AppleWebKit/537.36 (KHTML, like Gecko) Chrome/74.0.3729.169 Safari/537.36"
123.123.123.123 - - [07/Jun/2019:18:49:03 +0100] "GET /feed/data.json?id=100925&start=1559843342708&end=1559929742708&interval=108&skipmissing=1&limitinterval=1&apikey=abcd1234abcd1234abcd1234abcd1234 HTTP/1.1" 200 7279 "https://myserver.com/vis/multigraph?embed=1&mid=100018" "Mozilla/5.0 (Windows NT 10.0; Win64; x64) AppleWebKit/537.36 (KHTML, like Gecko) Chrome/74.0.3729.169 Safari/537.36"
again these 6 lines appear every 30s in the access.log.
In addition to the above multigraph data updates every 30s (or whatever interval you’ve set) you should also see a line every 5 seconds, you can see them in my dev console image above, they are the /list.json?userid=100002 lines. They too have a corresponding entry in the access.log that reads
123.123.123.123 - - [07/Jun/2019:18:56:51 +0100] "GET /feed/list.json?userid=100002 HTTP/1.1" 200 3522 "https://myserver.com/example" "Mozilla/5.0 (Windows NT 10.0; Win64; x64) AppleWebKit/537.36 (KHTML, like Gecko) Chrome/74.0.3729.169 Safari/537.36"
These requests are to do with the emoncms dash webpage (rather than the multigraph data) updating, It might help you debug this if you knew if these 2 types of requests are still being made after “the crash” and if they are, what response they are getting.