@Jon, @Robert.Wall, @overeasy
Thank you all for the help. I have gained a lot of insights from this discussion.
I had seen the archived posts before and they set me on the path of creating virtual feeds. The final output value for my feeds was correct but I could never get them to display. When I tried to plot them, the graph routines would throw a lot of errors, as I said before. But further searching through the forum revealed that you, Jon, had the same problem at one time.
And there is no Post Process page (Setup > Post Process) available. My system must be out of date, even though I had only received my emonPi in mid-August. I was running the same emoncms version as you were experiencing problems with. An update of the emoncms to v9.8.18 has resolved all issues. The virtual feeds are now displaying in a graph. I now have the Post Process page. I am interested to see how this concept develops.
Below is my current effort showing the energy consumption in different colours for different tariff rate periods in the day.
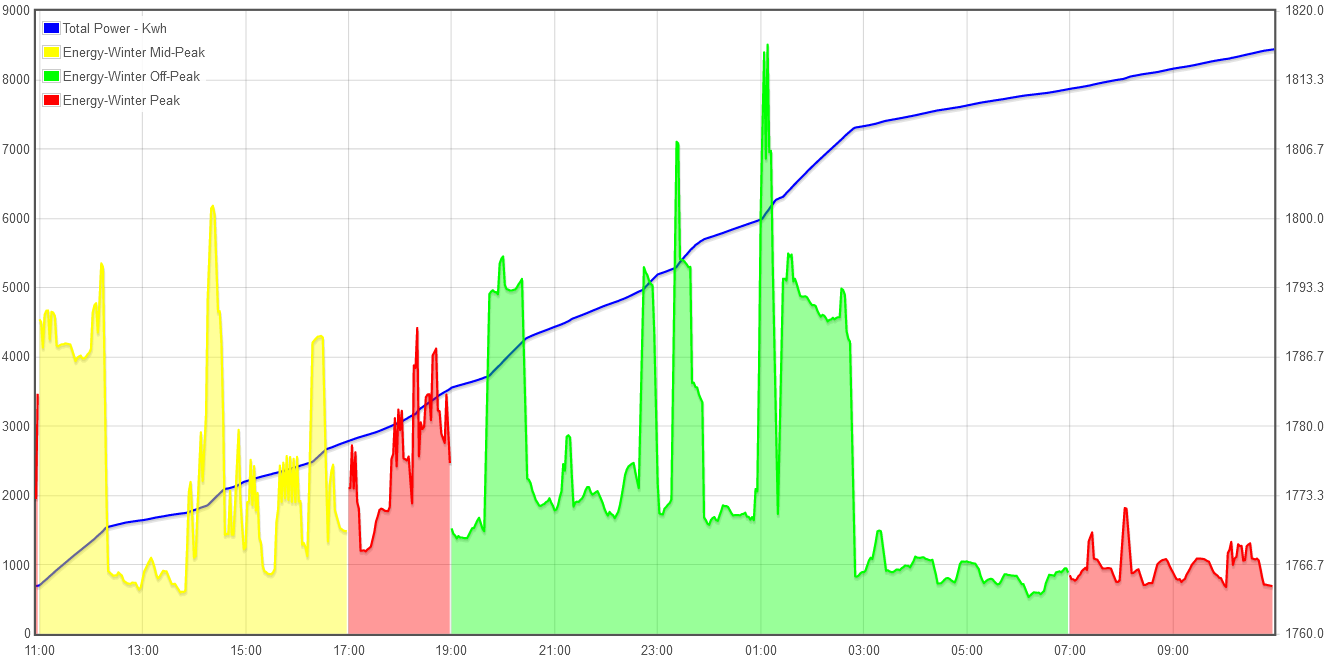
Now I hope to create a virtual feed that reflects the accumulated cost based on the tariff rates for each period and hopefully resets to zero each day