Measuring reactive power to build NILM system

Dear all,

I’d like to try building a non-intrusive appliance load monitoring system using OpenEnergyMonitor components. As I have a single phase system, I currently use an emonPi with 1 CT and an AC sensor input to monitor the main power line.

Most research papers I’ve with respect to non-intrusive appliance load monitoring, perform clustering of appliances in the P/Q plane (real power vs reactive power domain). In the getting starting guide only apparent/real power is mentioned.

Is it possible to measure or approximate reactive power? If yes, how do I proceed?

Thanks in advance!

grtz, Koen

In theory it should be possible to write a sketch to extract the reactive component directly, but as far as I know, it has never been done. You would need to multiply each current sample and voltage sample to obtain real power - exactly as the standard emonLib sketch does now - and at the same time you would need to delay the voltage wave by 90° (to align it with the imaginary axis of the phasor diagram) and multiply the current sample and the delayed voltage sample to obtain the reactive (imaginary) power.

I hope your mains frequency is constant, because any frequency variation becomes a timing error that could look like a phase shift. For that reason, I’d suggest you look at MartinR’s PLL energy diverter and build a sketch around that principle. That should at least mean that the stored voltage wave remains accurately in quadrature. (You choose the number of samples per cycle to be a multiple of 4, naturally).

I would not suggest you try to use Pythagoras on real and apparent power, as most well-behaved loads will be close to unity power factor and the errors will become large and variable as you get closer to unity power factor.

If you don’t use mainly OEM parts, many dedicated energy monitoring ICs do make these outputs available, but I must caution you that many suggested application circuits show a direct galvanic connection to the supply so unless you add the proper isolation, they could be very dangerous and potentially fatal.

Thanks Robert for the quick response!

How do I delay the voltage wave by 90°?

Could I use a similar approach like in the emonTxV3_4_3Phase_Voltage.ino sketch?

#define PHASE2 6                                 //  Number of samples delay for L2
#define PHASE3 14 
#define BUFFERSIZE (PHASE3+2)                    // Store a little more than 240 degrees of voltage  

phaseShiftedV2 = storedV[(numberOfSamples-PHASE2-1)%BUFFERSIZE] 
            + Phasecal2 * (storedV[(numberOfSamples-PHASE2)%BUFFERSIZE] 
                         - storedV[(numberOfSamples-PHASE2-1)%BUFFERSIZE]);

Here a circular buffer is used to get measurements at respectively 120 and 240 degrees, but I don’t understand how to set the constants for the 90 degree case.

Any ideas?

grtz, Koen

Of course I have ideas - I wrote it :open_mouth:

You are on the right track - you store the voltage samples in an array, exactly as the 3-phase sketch does, and you know how many samples you have per cycle ( = 360 °), so the sample that’s delayed by 90° is a quarter of the number of samples behind the present sample. Of course, it’s slightly complicated because you will need to interpolate between two samples to account for the phase error between the voltage and current transformers and the timing error between voltage and current samples. That’s what the “phaseShiftedV” is - delayed by a whole number of samples plus a fraction by interpolation between samples.
(This concept for the phase correction is explained in the Resources > Building Blocks article about phasecal.)
That 3-phase sketch is not phase locked to the mains frequency, so it does not have an exact multiple of 3 samples per cycle, therefore the 120° and 240° points will not normally coincide with a sample. That is an added difficulty and is why I suggested using a PLL - it avoids that problem.
(And you will only need to store 90° of samples plus 1, as any more will never be used.)

Thanks once again for the fine explanation. The documentation about the PLL on the website is very good, but as a first attempt I’ll stick with modifying emonlib as I’m using emonPi instead of emonTx and don’t feel that courageous, yet :wink:

Please note that it seems there’s a bug in Home | OpenEnergyMonitor as it reads 249 in stead of 240 degrees:

phasesample=samples - (int)(NUMSAMPLES * 249/360); // phase2 is -240degrees

That does indeed look to be a typing error. Petrik does not appear to have registered on these new forums, I’ll try to get a message to him.

perform clustering of appliances in the P/Q plane (real power vs reactive power domain)

You might want to confirm exactly what they’re referring to when they say “reactive power”. Once there are harmonics in the current signal (and there always will be assuming you have plenty of switch mode power supplies in your load mix), “reactive power” becomes a bit of an overloaded term.

Here’s what my energy monitor reports for my GPO1 circuit (general purpose outlets, aka power-points):

At the time the loads were a good mix of electronics (computers, modems, printers, TVs, amplifiers, PVRs, lab equipment etc.) and the power factor is about 0.86. The first thing to notice is that the power triangle is broken: 5172 + 39.22 is way less than (251 x 2.38)2. What’s not shown is the distortion power which was 298.9 VAR at the time. Note that 5172 + 39.22 + 298.92 does equal (251 x 2.38)2

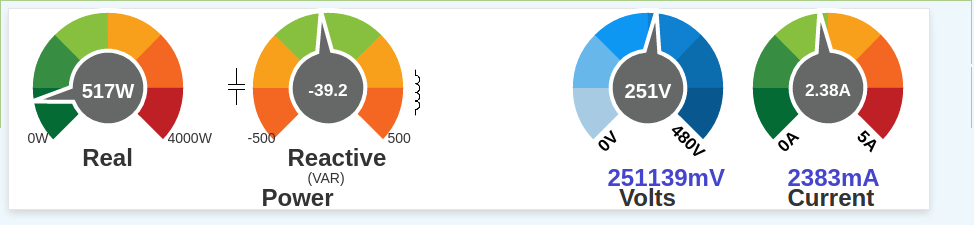
Once there are harmonics involved, Apparent Power (which is always Vrms * Irms) becomes the sum of three orthogonal vectors: Real, Reactive and Distortion as shown in this diagram:
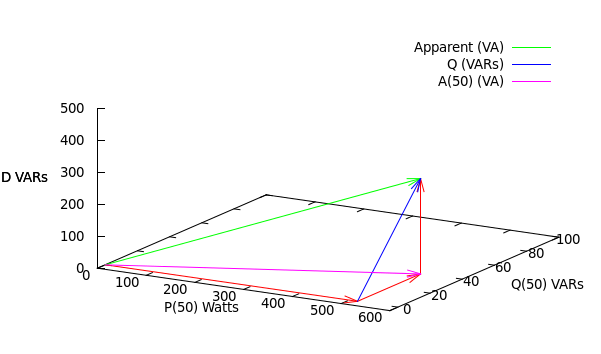
The three Red vectors are the raw ingredients: Real, Reactive and Distortion respectively, that add together to give Apparent Power (Green). I’ve labelled the Real axis P(50), the Reactive axis Q(50) and the Distortion axis D.

A useful mental simplification at this stage is to assume your V signal is a pure 50Hz sinewave and that your I signal has plenty of harmonics in it (we can add in the minor complication of small harmonics in V later1). When you multiply rapidly sampled V*I samples together like emonlib does (and in my case the energy IC does) you get Real Power (517W in this case). Now if you delay the V signal by 90o and multiply that by the I signal, you’ll get Reactive Power (-39.2VAR in this case).

In both calculations you’ve extracted just the 50Hz component out of the I signal, because the 50Hz V sine wave is orthogonal to a 100Hz sine wave (and to a 150Hz sine wave etc.); their dot product will always be zero. So all those harmonics in I will never show up in either of those two calculations and that’s why I’ve labelled those axes P(50) and Q(50). But those harmonics do show up in Irms (and hence Apparent Power) and so the two dimensional power triangle is broken. Distortion Power comes to the rescue and makes up the difference. Unlike the other two, Distortion Power can have no sign (or phase) because there’s no V at those frequencies to compare it against.

The two methods Robert mentioned: delay V by 90o or use Pythagoras on Apparent Power and Real Power will give you two very different results. The first method gives you the second Red vector (Q50) and the second method gives you the Blue vector. They’ll only be equal when the third Red vector is 0, i.e. there is no distortion in I, i.e. I is a pure sine wave.

If you’re trying to distinguish between your TV coming on and your computer coming on it may well be that the most distinguishing factors are in the harmonics in I. If you just use P(50) and Q(50) you’ll miss all that detail. I’m pretty sure the smappee product do their cluster analysis on a vector of harmonics in I (I can’t remember how high they go, but they used to expose it all on one of their debug pages).

  1. In reality your V signal will be slightly distorted. Rather than being a pure sine wave it often shows up with a slight flat-top. The measurements above (517, -39.2 and 298.9) were all true measurements, i.e. they took no short-cuts and made no assumptions about the purity of the V signal. So long as you do the V*I calculation, you’ll pick up the true measurements. The “error” introduced by the simplification above is simply one of labelling. P(50) and Q(50) become slight misnomers in the case where V isn’t a pure sine wave. The measurements (517W and -39.2VAR above) will be correct as per the IEEE definition, but they won’t strictly be just the 50Hz component. They’ll be primarily the 50Hz component, plus a bit of what otherwise would have got classified as Distortion Power. Some of that Distortion Power leaks into the Real and Reactive Power calculations as the harmonics in I find some harmonics in V to multiply against.
6 Likes

I know this topic was discussed a long time ago, but I am having the same problem. I need to measure the reactive power, and the emonPI gives me active and apparent power. My first approach was to calculate the reactive power using Pythagoras. I do not understand the first justification against this procedure. Why can’t calculate this way?

Following the dBC explanation, what emonPI provide is the Apparent Power = Vrms * Irms, e.i., the green vector on the figure. That Apparent Power already contains the influence of the harmonics present in V and I, so in other words, already account the impact of the distortion power. If we use these Apparent Power, Active Power that emonPi provide, we already have the Reactive Power (blue vector on the figure). Is there anything I misunderstood?

Welcome to OEM and to the forum.

What you say is correct - in theory. And if you have a poor power factor, Pythagoras is likely to yield a good approximation in practice too. But the two values, real and apparent power, will each contain errors (in the real power particularly, introduced largely by the phase compensation algorithm - but both will contain rounding etc errors), and that means that when the power factor is close to unity, the error in the difference between the values (squared) can be large, hence the error in the value of the imaginary power is likely to be large.

So yes, that method will work. How accurate the result will be is an entirely different question.

You can, and as you say, you’ll get the Blue vector (or at least its magnitude) when you do. When I said the term “reactive power” is overloaded I meant different devices have different definitions. My energy IC calls the second red vector (on the Q(50) axis) “reactive power”. More modern ICs call that “fundamental reactive power”.

The real problem with using pythagoras is you lose all sense of sign. Reactive power can be positive or negative and that distinction is likely to be helpful in your appliance recognition learning.

I don’t claim to be an appliance recognition expert but I’ve seen how at least one other does it. They do it all in the frequency domain (which I’m told is also how speech recognition engines work). For each harmonic (including the fundamental) they calculate Real and Reactive power, and both are signed quantities. I can’t remember how high they go, but I think it was less than 10 harmonics. If for arguments sake it was the fundamental and 9 harmonics, then for each “event” (device coming on or off) they calculate 10 pairs: (P0, R0), (P1, R1)… (P9, R9) which is the difference from before and after the event. Then they train their model on those vectors.

Compare that with just the length of the blue vector (total reactive power) and the length of the first red vector (real power) and you see how much detail you’re missing. But if those two numbers are sufficient for a successful learning model, then I suspect you could just as successfully use Apparent Power and Real Power and save yourself a square root. If the model can latch onto the former pair, then it should also latch onto the latter pair, since there’s a one to one mapping between them.

Maybe hang one of these: USB Accelerator | Coral off your RPi.