Laptop IE also popuped a .146 (the emonpi) is not responding due to a long running script.
The tablet running ID13 on Opera crashed also.
Judging on the laptop’s error, it almost sound like a buffer overflow or running out of memory problem, no matter which browser is used.
The pytty log doesn’t show anything strange either, it just stops requesting data from the Emonpi.
Here is the log file with the tablet running Opera. Search for ******* last request from the tablet:
id13 tablet opera.txt (1.7 MB)
Just for fun, I looked at the app information under settings/apps/opera/memory, and even though Opera had crashed, the memory used in the last 3 hours was 481Meg!
I would think that this may be why any apps are crashing… memory overflow?
Just a wild guess, but it doesn’t seem to make any difference which browser is used.
Memory management doesn’t work very well (or at all).
Also happens on the laptop running win 7 64 bit / chrome (or firefox or IE).
Doesn’t seem to matter which machine/OS/browser is being used, but is a common problem that causes this.
Could you try running dash id13 on your original test environment (tablet and browser?) to establish whether the extended period of running is due to a change in browser or an increase in the multigraph update interval? If it reverts to 7-8hrs, retest in IE just incase it was a fluke result.
If id13 runs any longer than 7-8 hours (maybe not as long as 24) that would help narrowing the search as it indicates, less multigraph traffic = longer life. It could indeed be memory overflow, but we need to what is overflowing/clashing/timing out so the next test would be to try turning off the auto-update on id13 or at least setting it to something like 600 or 1200 secs and see if that extends the time at all.
As I previously explained, there is one request every 5s to update all the widgets, this is done by requesting a single full list of all the users feeds with their current values. So you will not see any dial or gauges ids in the requests and the traffic will be the same whether it’s 1 or 101 dials and gauges. The userid=1 is your id.
Graphs that do not auto-update request their data when the dash is first drawn and then only when the graph is manipulated or the page is refreshed. Multigraphs and realtime graphs are different as they repeat their requests for every update interval, that’s quite a lot of data over 7-24 hrs. These id’s you will see in the requests, the realtime every 1s has “vis/realtime” in the url and multigraph requests have “vis/multigraph” in the url and use both a “mid=” (multigraph id) and a feed “id=” as each muligraph will request a full set of data (24hrs?) for each feed in each multigraph.
I am trying that now. I restarted the tablet and will load ID13 with the new multigraph update intervals of 60 seconds.
I started at 1010 hrs.
One thing I saw was that Chrome had used 0.91 Gigs in the last 3 hours. This is just after the crash today.
At 9:15 the dashboard was running, and at 9:30 ish, it had crashed. I had started it at about 0130 this morning.
all multigraphs update at 60 seconds except EV Energy… that is 3600 second.
The Kwh tot bargraph is 1 day.
The gauges and dials update when they receive data.
I am re running the tablet with ID13, Chrome in incognito mode, and will monitor the memory usage “within the last three hours”. this is under settings/apps/Chrome/memory usage.
It is now at 354 Meg, but that could include prior usage.
Thanks for the explanation on how gauges/dials/multigraphs/graphs work. If nothing else, it satisfies my curiosity, and MAY help me also.
It would be interesting if you can isolate which widgets or graphs cause the dashboard to crash. Perhaps it would be worth trying a dashboard with only one dial on it and then a dashboard with only one graph. So far my basic test of a single dial is still running a day in, I will add a graph to it next.
Hey Trystan…
I did create a dashbd. with only gauges and only multigraphs, but didn’t run it extensively. I will have to give them a try again now that I have changed the multigraph update interval.
I can also monitor the memory usage for each one.
Just a thought… since gauges and dials don’t display historical data, and seem to only display instantaneous data, a graph (realtime/multi/graph) shows historical and instantaneous data, is a buffer created for each graph that stores data from start of dashboard run until present, and depending upon how many graphs are being displayed, after several hours the buffer overflows and crashes the dashboard? Make sense? (my terminology is probably incorrect).
So if you have a dashboard with only 1-2 graphs, it would take a long time to overflow the buffer, but if there are several graphs on the dashboard, it would crash sooner?
A dial/gauge dashboard should not crash.
I will try that and see what happens.
1 Like
Yes that may be the case. The dial test is still working here and Im now adding a multigraph to it with the floating time setting enabled. Im testing on a screen connected to a raspberrypi 3 b+ using the chromium browser that comes with the stretch os.
Interestingly chromium makes it particularly easy to see the memory use, here’s the memory use for gmail which I’ve found particularly slow recently:
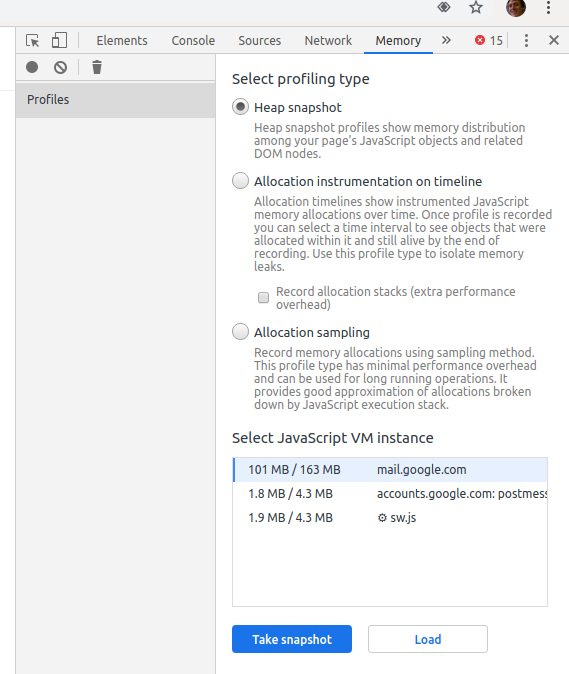
The emoncms.org dashboard on the pi is using 5.0 MB after it settles down about 10s after initial load. The dial by itself was using ~7mb after almost 2 days. I will report how the dial + graph changes over the next few hours.
Interesting test! Hopefully something will give us a clue!
I made a dashboard with 2 dials and 5 gauges (7 total), and I noticed that memory usage for Chrome on the tablet, would start at about~200meg, and throught the day creep up to over 400 meg. and then I would find it crashed. Memory usage at that time was closer to 500 meg.
The thing being that the memory usage would just keep climbing.
Now with the gauge/dial dashboard, memory is around 150 meg.
I’ll see where it is in the morning (IE after I get some sleep!). Bet it is still about 150 meg!
When you add the graph, if you can watch the memory usage and see if it creeps up.
You may not get a crash, or it may take a long time, but if the memory usage slowly increases with the graph running, that may be the clue!
And you are even running on a different platform/OS/browser too!
@TrystanLea - Just thinking out loud here, but is there any reason that auto-updating graphs like multigraph couldn’t do an initial request (like a non-auto-updating graph) and then just snatch the latest values from the same feed list as the dial widgets every 5s?
It could just reuse the same data set over and over, but drop the oldest value each time a new value is added, this could make a much faster default refresh frequency of 5s a much lighter load on both the server and the browser.
It would also (easily?) accommodate averaging rather than sampling, eg if the sample interval of the displayed graph is 120s, then every 24th feed list update it can average the 24 values and add a datapoint (dropping the oldest), over a prolonged display time the graph would display a much more accurate plot than the original “sample set” method.
Another welcome side effect of this would be that the graph profile would remain static as it moves to the left with time, currently if you have a (for example) 10s phpfina feed and view it via a 30s multigraph, the profile can change dramatically every 30s rather than just scrolling left. This is because the sample interval of the graph (eg 120s) pulls a different sample set of data each time.
Ideally the refresh time should match the interval of the displayed data as refreshing any sooner than that just shakes things up without really providing any greater detail except the latest value, which is often, also displayed in a dial or feedvalue widget. However that interval can be set by the user by changing the zoom level so it’s not easy to set an optimum (static) refresh rate.
Update…
I ran my gauges/dials only dashboard starting at about 0130 and it is still running just fine.
I looked at memory usage for Chrome and it is staying at 150Meg and maxed at 180Meg.
No change in the usage!
This tells me that graphs have a problem with memory usage and consume more and more memory the longer the dashboard runs… rather than just updating what is being displayed. A buffer overrun problem? Why does the dashboard keep old data and not just FIFO? Is there are reason to keep old data for graphs?
Is it just realtime and multigraphs causing the issue then?
And when you apply a longer interval (60s rather than 10s) it lasts longer (24hrs not 7hrs)?
So if you turn off auto-update, does a dash with a multigraph last indefinitely?
If so going all the way back to your original dash with 4 multigraphs and loads of dials/gauges, if you turn off auto-update, does that dash last indefinitely?
If it is just multigraphs (and realtime) and the interval and number of plots (ie traffic density) defines the duration of the dashboard before crashing, that confirms my suspisions and goes quite a long way to narrow the search.
I do not think it has been done that way deliberately, no there is no good reason to keep old data since a whole new dataset is requested at every auto-update, nothing is reused. So why the old data would be retained I do not know. I always thought this was a fairly inefficient way of doing things with regard to load and bandwidth etc but js and php isn’t my strong suite. I have suggested an alternative way of approaching the auto-updates above but Trystan hasn’t commented yet. I doubt this will be high on the agenda just now as I know there are many other things being worked on. So if it is confirmed to be a an issue due to the old data being retained, I think the best we can hope for in the short term is a bugfix to release/reuse that memory.
Well not so fast! Seems that the dashboard crashed about 23 hours later.
When I last looked before it crashed, memory usage was over 400 meg with peaks at 520ish. That was maybe 3 hours before the crash.
Remember, this was 4 dials and 3 gauges only. No other elements.
Yes it lasted alot longer, but still crashed with high memory usage.
Evidently not… just prolongs the inevitable.
No. I had set all my multigraphs to 60 second update times, and the dashboard still crashed in about 7-8 hours. I did notice that even though my inputs processing are set for 10 second updates, my gauges/dials can update within 3 seconds. Shouldn’t they update at the feed update rate?
Haven’t tried that yet. If I run my ID1 dashboard (combinations of dials, gauges, multigraphs), judging by my gauges only dashboard run, it will still crash as the dials/gauges still eat up memory.
Well no it seems to be all elements that will crash the dashboard. I don’t know about an LED though.
It surprised me though as i though we were on to something?!?! While the gauges/dials dashboard was running, for just over 12 hours of run time, memory seemed to be pretty stable at around 180 meg usage.
Then ~14 hours later it had drastically increased to over 300-400Meg for some reason. Then the crash at about 500 meg… at about 24 hours
Does this look like a memory leak? Possible memory corruption? I don’t know !
Just seems that update rate doesn’t seem to matter… the dashboard still crashes.
Same results as of 24 hours ago.
How much memory is in the machine that’s crashing?
I’ve had stable, albeit SLOW, operation in Windows with 1.2 GB of RAM in use.
That’s good to know its happening for the dials as well. I think we need to get to the point where we can replicate this on multiple machines. How are you reading the memory use for chrome @pomonabill220?
I didn’t see the memory use for a dial and a multi graph increase that much yesterday, it went from 5MB up to 9MB then back down to 6mb and appeared to oscillate around over the span of hours. Over 24h later its at 9.1MB and still running.
While its true loading the whole graph for every update is not very efficient in terms of bandwidth it should not if working correctly cause a memory issue, the data object is overwritten each time. I did implement a visualization with the way you suggest @pb66 in the past but I think there was an issue with it, I cant remember now. It would be a nice to have feature but should be seperate from the issue @pomonabill220 is seeing.
It is a Lenovo TB-X304F tablet with 2Gigs ram and 16Gig storage.
It is running Android 8.1.0
I am selecting Settings/Apps/Chrome and the entry is displaying memory used and memory used in the last 3 hours.
I noticed that sort of behavior for the first, roughly 12+ hours, THEN the memory usage started to climb before the crash.
I might add that I did increase the size of two of the gauges by dragging their bounding box in the edit screen, but didn’t think that would affect the memory usage.
I restarted the tablet this morning at 0945 and loaded the gauges/dials only dashboard.
I will let that run and keep an eye on the memory usage just incase there was something left over in memory that didn’t get cleared out.
1 Like
Great thanks @pomonabill220 I’ve still got the dashboard running in the office, will update on monday how the memory use is going. Il try and get one of our android tablets up and running again too.
Thanks Trystan for running a test on your system. I will be interested to see what you find out.
My gauges/dials only dashboard still crashes about 12 hour after starting, and showing greater than 900 megs of memory usage.
Right now, I have just resorted to reloading the page each time as i don’t know what else to try.
When I use my EV charger with MQTT control, it doesn’t crash and works great, but looking at the putty log, it appears to use a different method to process the data and talk to the charge controller, and doesn’t have the crashing problem.