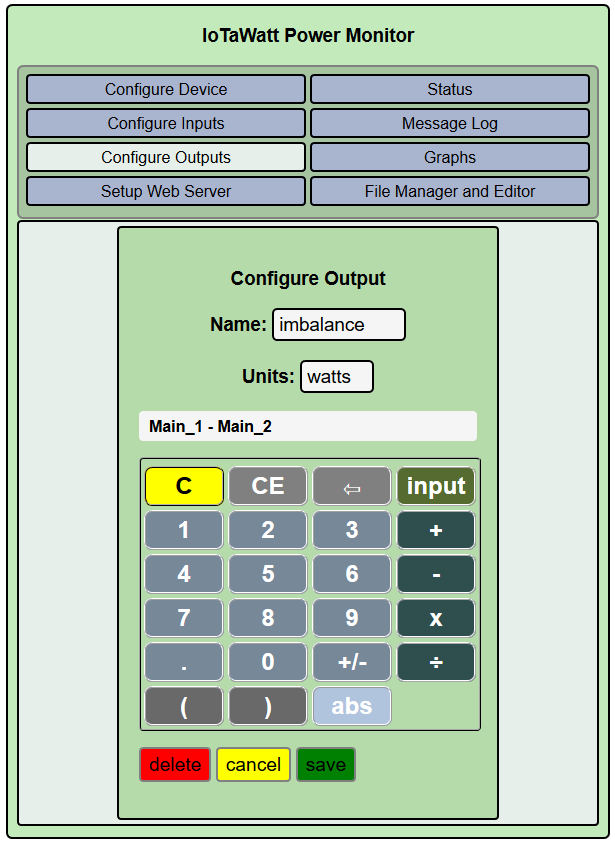
I did that with my IoTaWatt in local graph mode. I defined an output that was the difference between the two mains and then just added that to the graph:
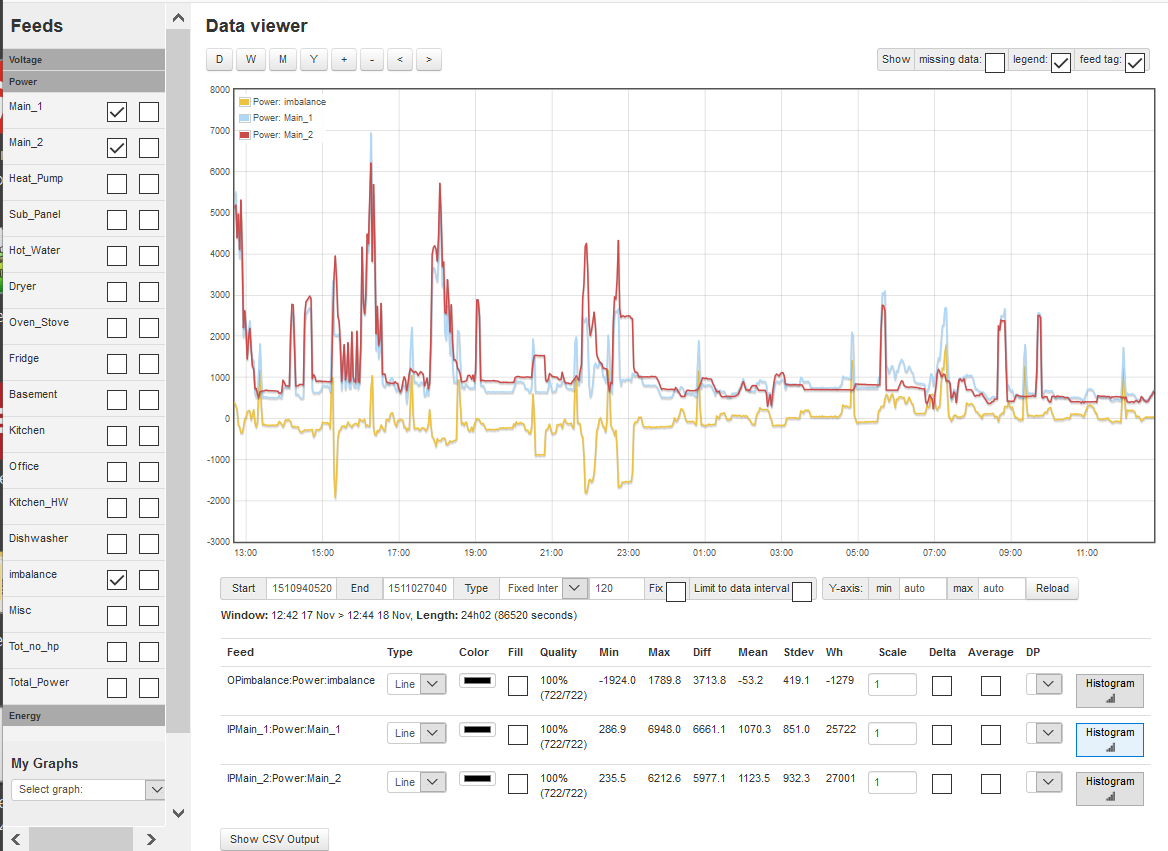
Then I ran the local graph app (modified Emoncms graph app) and selected that output along with the mains:
The advantage with using IoTaWatt outputs is that it’s just a script that runs against the selected data, so you can define an output and view it against data from today or last year. The datafile holds all of the raw input data and everything is computed in the query using the internal scrip system. Same goes for uploading to Emoncms or other servers.
I’ve got a number of outputs defined. I define Total_power as the sum of the two mains. Because I don’t have CTs on every circuit in the house, I define an output called Misc that is the sum of the mains minus all of the measured circuits. I have another that tells me my total usage minus the heat-pump.
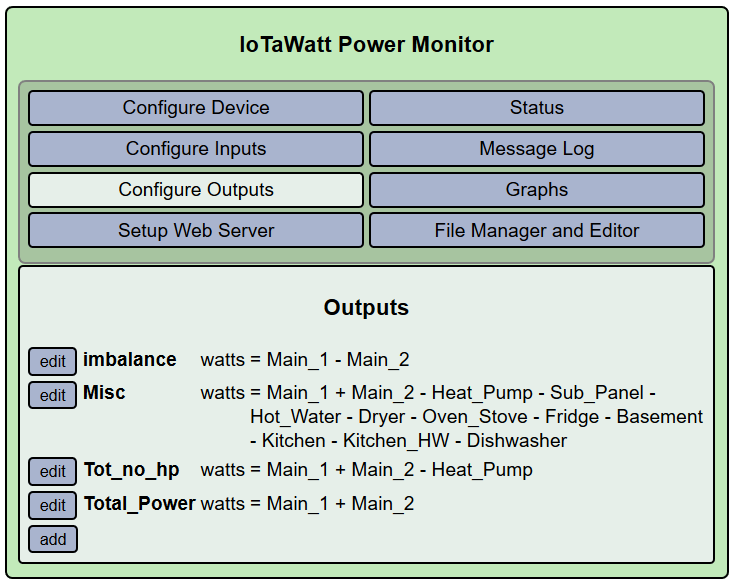
These outputs can be created on the fly and plotted immediately. No need to restart or wait for data files to be built.