I have a Virtual Feed that is a sum of two other realtime feeds. If I look at the current value of the virtual feed at any time, it appears to be the correct value (Feed1 + Feed 2). However, if I look at any historical data, the Virtual Feed is no longer the sum of Feed1 and Feed2. See the below table for an example of what I’m seeing.
There are a couple threads here at the community that are similar to what I’m experiencing, but those threads don’t have any solutions. Hopefully we can put this to bed with this thread.
ETA: I’m running EmonCMS 9.8.7 on my home server with the VirtualFeed.php from 9.7.5 since the commit for 9.8.2 was broken. Looks like there are some very recent commits for this, but I’m not ready to go master unless there’s a really good reason.
The feeds are both phpfina with 5 minute intervals.
The data in the table is from the built in Data Viewer (https://server.com/emoncms/graph/[feed_id]). I select the three feeds (Feed1, Feed2, and Virtual), set my Fixed Interval to 86400, then click the “Show CSV Output” button. I then copied into a spreadsheet to manually calculate the sum of Feed1 and Feed 2 and calculate the deltas.
I think I figured out at least one issue. And, as usual, it’s user error.
I was using a “Source Feed” as my first feed into the Virtual Feed, but the second feed was a “+feed” instead of a “+source feed”. So now the math looks a lot better. However, the math is still off a little bit throughout the time series. And the last interval is off by a lot.
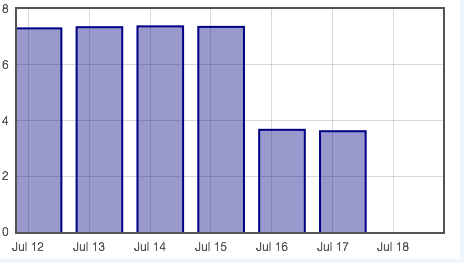
Agreed. The issue with the end of the data set means all my delta graphs look strange at the end though:
I’d like to get to the bottom of that if possible.
Thanks.
ETA: I wonder if this goes away if I am able to use the Graph module with Virtual feeds instead of using one of the old visualizations (bargraph in this case). Right now the Graph module only lets me use PHPFina and PHPTimeseries.
More adventures in user error: after figuring out that a) I didn’t have the Graph module installed properly and b) the Graph module DOES work with Virtual Feeds (just have to use a fixed interval instead of “daily”), I think I’m set.