I thought people here might be interested in my side project for the past couple of years: Taransay. I’ve used OpenEnergyMonitor hardware since around 2013 or so; I got an early version of the emonTx, emonTH, emonGLCD and the little receiver that connected to a Raspberry Pi 1 (emonBase?) and ran the emoncms forwarding service to my own emoncms instance on a private server. This worked well for a number of years, but with the hardware I bought using the 868 MHz RF modules instead of 433 MHz and thus semi-incompatible with the newer OpenEnergyMonitor stuff, and my desire not to have to buy an emonPi to get the newer sensor hardware plus continuing backwards incompatibilities with the emoncms software, I decided to go my own way and make my own hardware and software. The result is the Taransay monitor:

The board is roughly based on a combination of the emonTx, emonBase and emonTH. In fact, the board, depending on its configuration, can act as any of those boards. The board is a size that’s compatible with a Raspberry Pi hat: the header on the bottom left connects to a Pi (any normal sized version; I’ve tested on the v1 and v4; should even work on a Zero) and there is also a gap on the board for the camera cable. It can alternatively be powered via 2 x AA or AAA batteries and used as a wireless electricity, temperature and humidity sensor or pulse counter. Having the board support all of these configurations means you only need to buy one type and configure them the way you want in order to get any of the original emonTx/TH/base capabilities.
Here are two built configurations: the temperature/humidity sensor on the left, and the same on the right but with added electricity monitor capabilities:
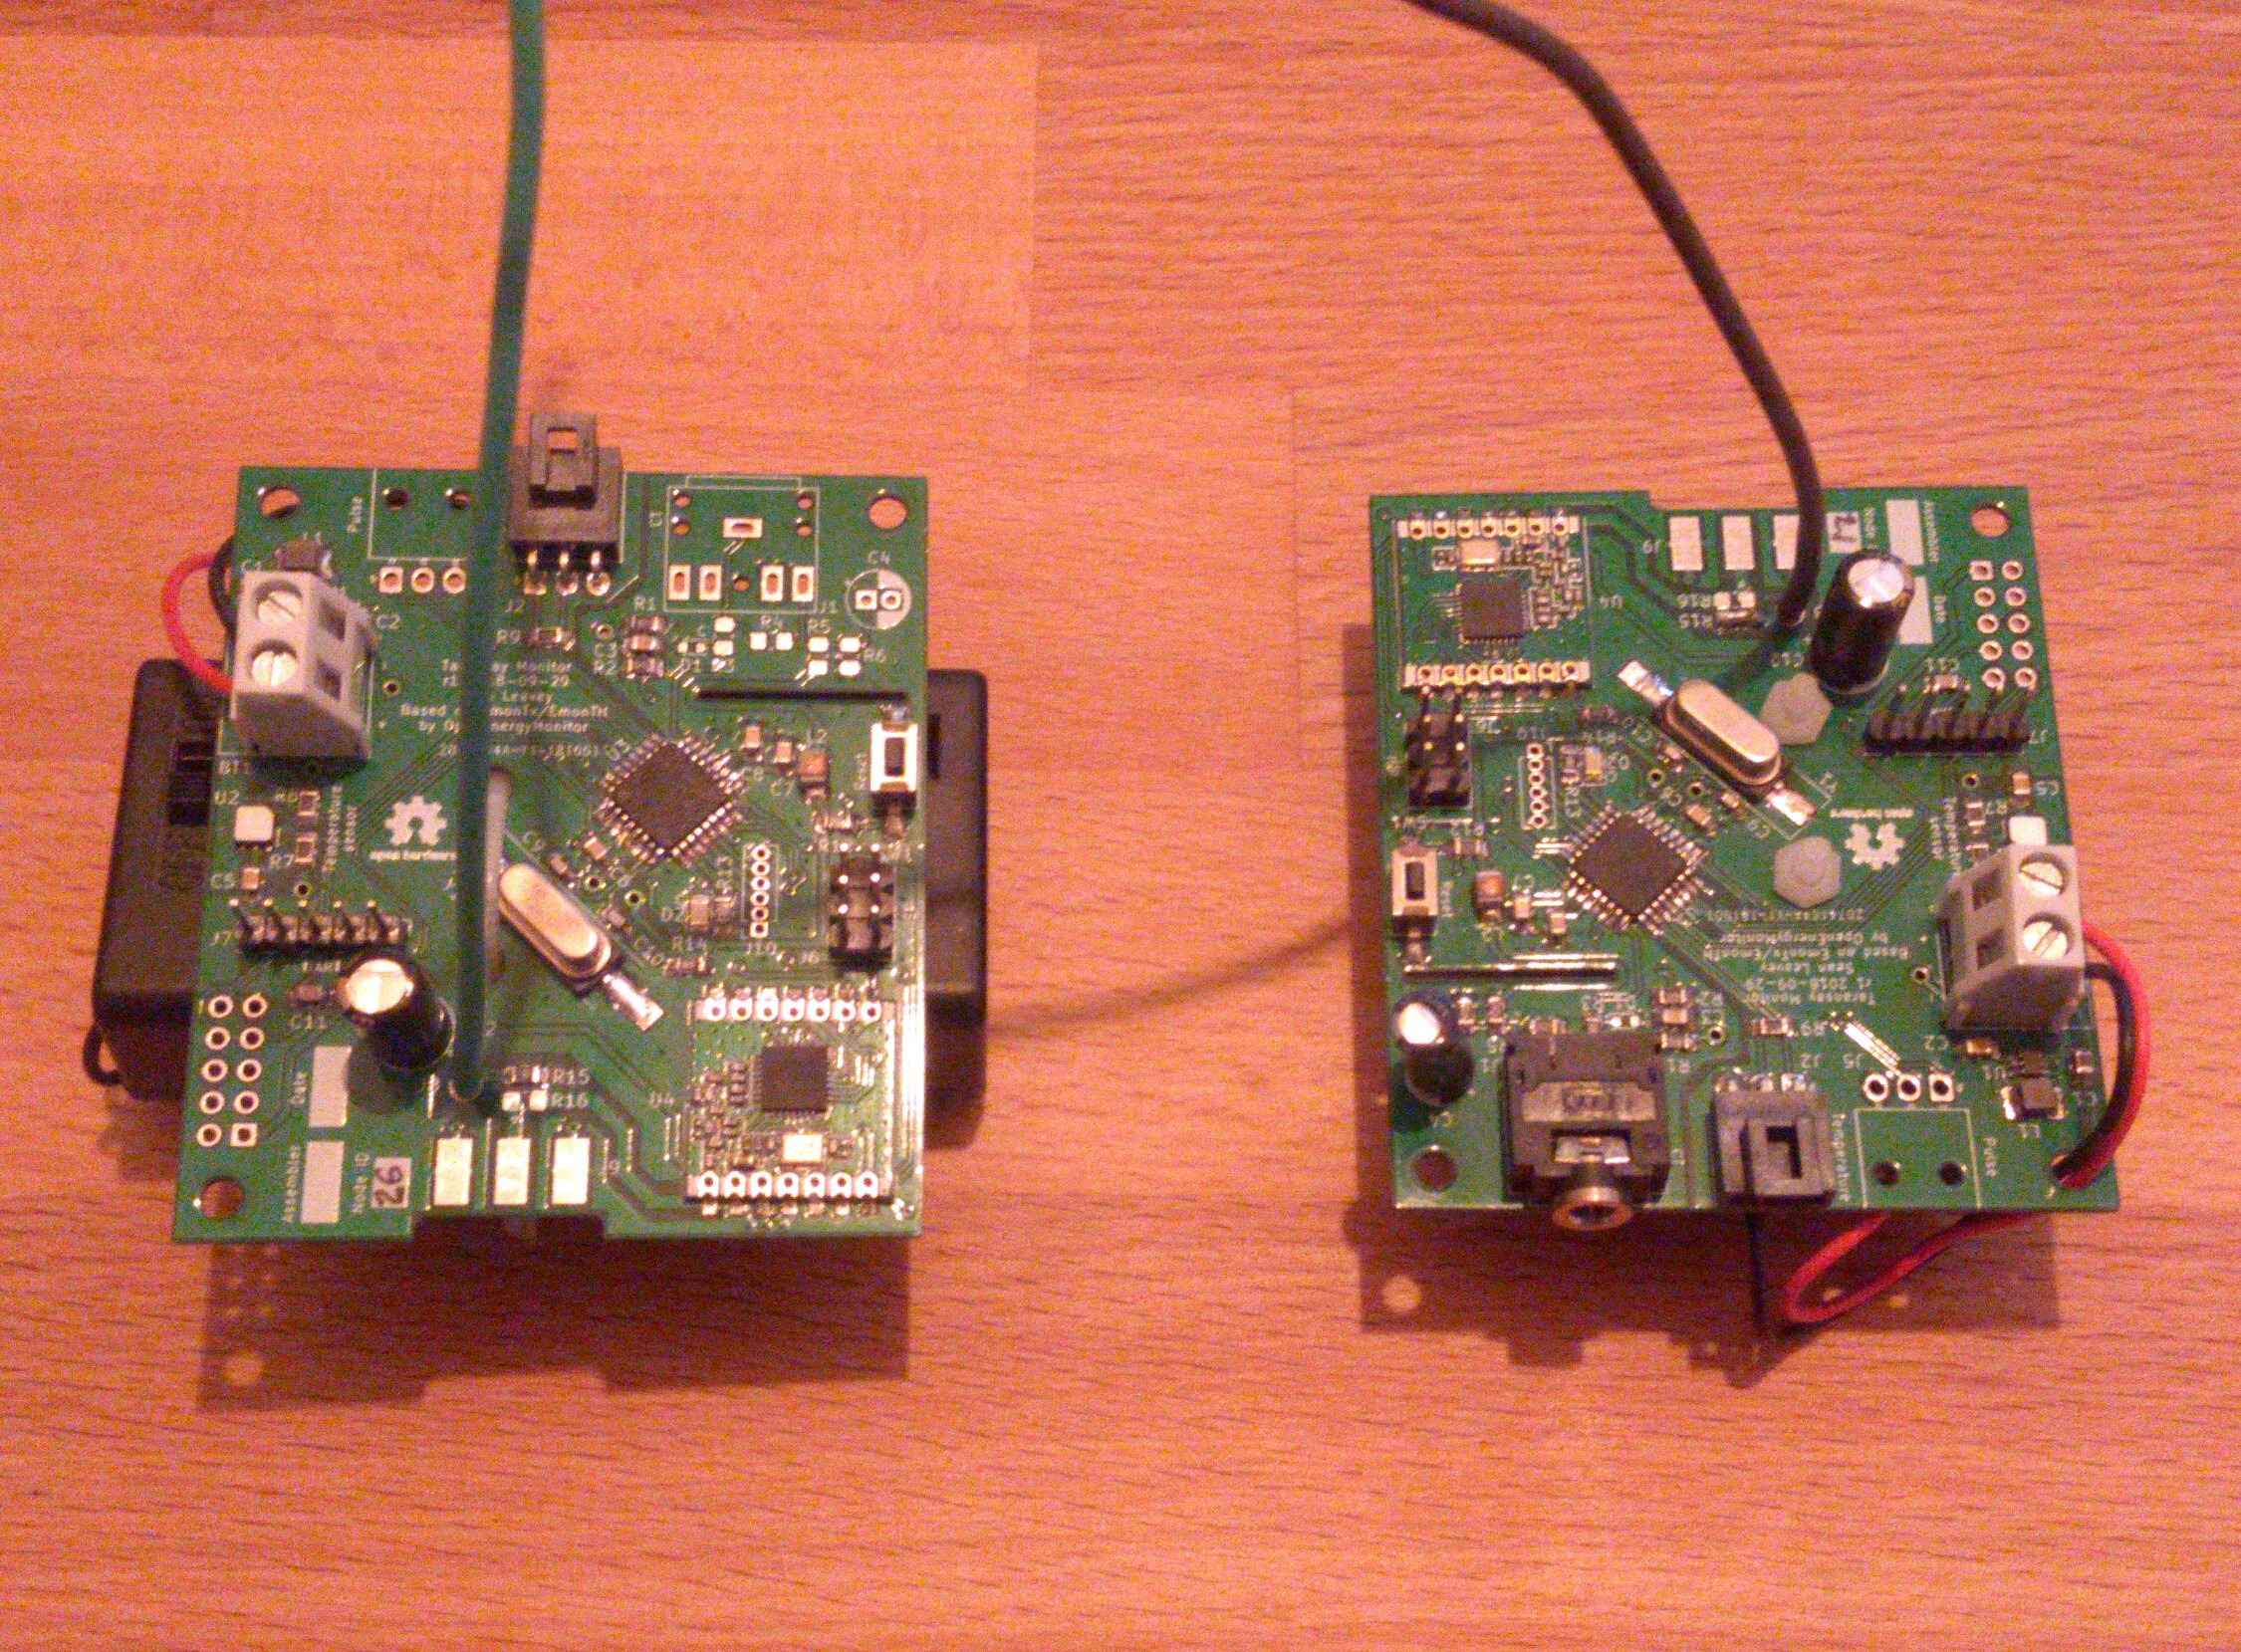
The main practical difference to the emon hardware are the connectors - I don’t like the headphone jacks used for the emon DS18B20 temperature sensors, though I kept it for the electricity CT sensor. The boards are designed in KiCAD.
I also wrote a software stack. The firmware is loosely based on the emon firmware; mainly borrowing the RF payload stuff but ditching a lot of the rest to simplify things. The ports on the ATMega328P are different so the actual emon firmware is incompatible. On top of the firmware is the data forwarding service on the Pi and remote web logging/plotting capabilities, explained in more detail below.
Configured as a base station the firmware forwards packets over serial to the hub software on the Pi, like an emonbase and emonhub. I initially configured the hub to send to my private emoncms instance by replicating the emon packet structure, but I recently decided to replace this with my own software to simplify things and remove the emoncms dependency (I don’t like it). This is still a work in progress but I can briefly describe some parts I’ve worked and am working on:
-
taransayhub: replacement for emonhub, running on the Pi and forwarding data to the web. This uses the modern Python asyncio library, along with pyserial to talk to the attached base station. This implements a data queue in memory which posts to a configurable web address, and handles unavailability of web services by backing off and trying again so no data is lost. The service also dumps its in-memory measurements to disk if the process gets stopped or killed, and reloads this data when next started - so black-outs or reboots shouldn’t affect it. Its configuration can be changed without restarting the service too, so readings from devices while restarting aren’t lost. It also compresses all its queued data before forwarding to the web, which I’ve found can provide data savings of up to around 70% - useful for posting data from remote locations with mobile data limits.
-
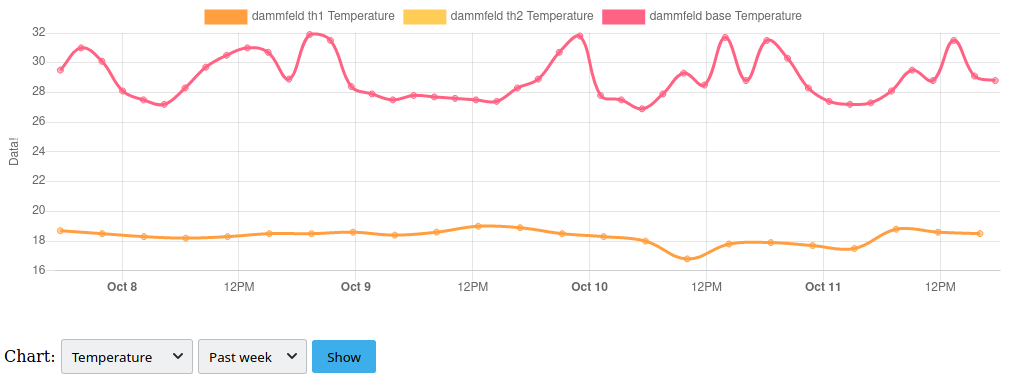
taransaydata: replacement for emoncms. This is a web service for handling, storing and retrieving data posted to it by one or more taransayhubs. This runs a Python web service that exposes HTTP REST routes for posting and retrieving data. There is also a rudimentary chart page to plot data via modern JavaScript using chart.js, but this is very much a work in progress. The underlying data is stored in flat text using the taransaydb library (see below), and is arranged into groups and devices like emon devices. Individual channels can be tagged as well, so groups of tags can be downloaded/plotted together. Here’s a screenshot of the plot page (very simple so far):
- taransaydb: simple flat file database. I think SQL is overkill for my application. There are databases designed for time series too, but you have no guarantee they’ll still be around years from now (and one motivation for starting all this was frustration with backwards compatibility). I often also just want to manually manipulate or plot my data. I therefore designed this database to store its data to flat text files: one file per day per device. Files get stored in directories corresponding to months, then years, then device ID, then group ID. Very simple to back up, very simple to compress, very simple to edit, split, modify, whatever. This database is a little complicated in how it handles reading and writing: as a challenge to myself I made it work with seriously little memory. Every function that manipulates the data does so in a streaming way, so it will never load the full data for a given day into memory, allowing the server to run on very low spec hardware (as long as it supports Python). On the downside, there can be more disk activity during sort operations, as I outlined in this blog post, but sorts are never needed if you don’t post from multiple taransayhub instances to the same taransaydata device (which would have the potential to create race conditions).
Anyway, the hardware is working basically as I want it after a recent revision (the headphone jack was on the wrong side!). The original hardware I actually finished in 2018 and around 6 of these units have run continuously since then only needing battery replacements now and then. With decent batteries, a temperature sensor can last about 1-1.5 years - so rivalling the emonTH (I copied most of the battery life performance firmware features).
The hub, data and database code needs a bit more polish but is working. Plotting definitely needs work, but of course the data is there in flat text form already and can be plotted using whatever tools you would normally work with: Python, MATLAB, Excel, whatever.
If anyone is interested I can find time to write up some more instructions for setting this all up, produce some Gerber files for board manufacturing and so on. And if anyone has any suggestions (or criticisms), I’m happy to hear them!