Hoping someone can help me. I currently have an EmonPi complete with 2 CT’s (1 for Electrical Feed and other for the Solar PV). I recently got a Pulse Counter and connected it to read the pulses from the Solar PV Din Rail energy meter.
I use Grafana and Home Assistant quite a bit for graphing and have in place an ESP32 running ESPHOME to log the pulses from my feed meter via Home Assistant and influxdb.
What I want to be able to do is record the pulses recorded for the Solar PV every 60 seconds so I can graph these in Grafana via Home Assistant integration. I’ve tried the Rate of Change option in EmonCMS but that returns a 0 value. What am I missing?
Apologies for the ambiguity, I am currently logging pulses via an ESP32 (for my Electrical Supply) and want to perform the same on the Solar PV using the optical pulse sensor on the EmonPI.
I appreciate that the CT and Pulse provide similar results however, I believe that the pulse will give you the most accurate results which allow me to look at generation historically, the CT provides me Real Time import/generation which is also very useful.
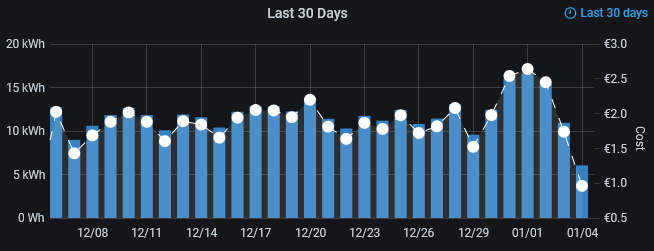
I want to be able to produce the below (which is my Import for last 30 days)
I’ve already added the EmonCMS component in Home Assistant, however the default logging for the PV Optical Sensor is an accumulator, I need to record the value change from the previous value to current value per minute. That’s why I looked at the Rate of Change option in the logging.
What exactly are you trying to store? The energy used in the last minute?
In the Input processing, store to a new feed the actual incoming values (before you do the accumulation process) and then store that in InfluxDB. Use InfluxDB / Grafana to do the addition of the data points in the required period for the graph.
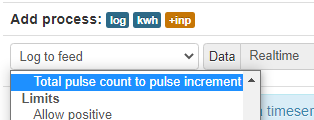
There is a Total Pulse Count to Increment process as well. You can have more than one log event (to different feeds) in an input process.