Yes, David has done a good job improving his performance. I need to focus in on my 6kW
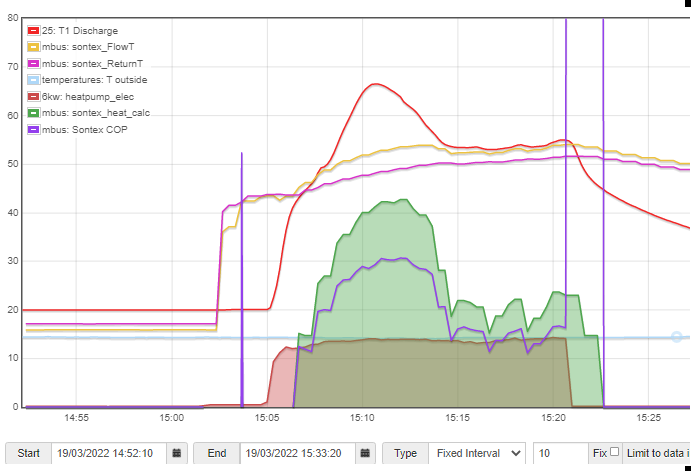
Find out why the COP plummets in certain conditions. I might need to join David and make a control to stop it running when it looks like the graph after 15:14
Yes, David has done a good job improving his performance. I need to focus in on my 6kW
Hi all, thanks @TrystanLea for starting the discussion, and thanks @Timbones @Rachel and @johncantor for sharing your thoughts already. There are (obviously) a lot of directions this could go in over time. My initial thought with this was similar to @Timbones’s point on aggregating daily data to understand usage patterns across time and across different users, but I think the leaderboard and linking to the heating system ‘meta data’ are also important aspects.
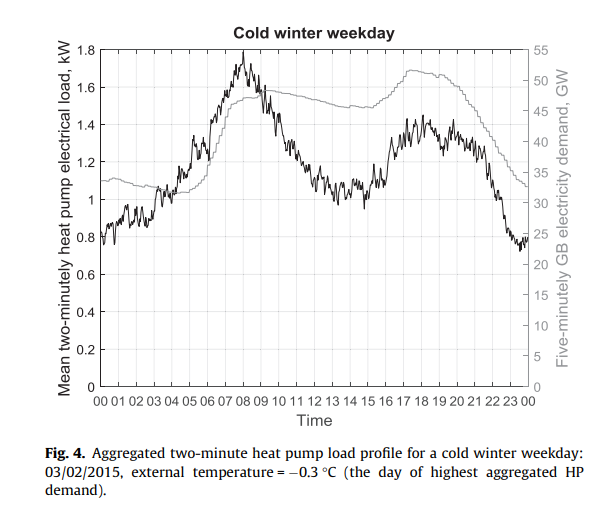
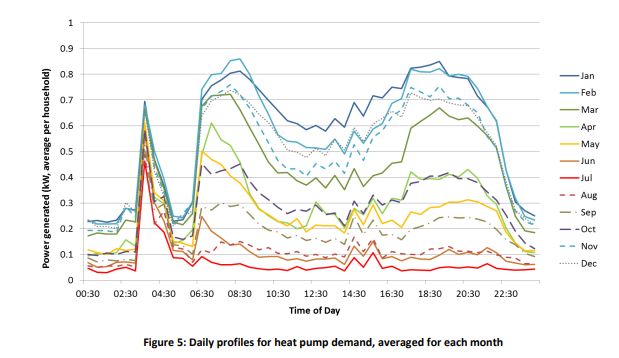
Right now there are a few studies which have used measurements to develop diurnal profiles for heat pumps, but there’s not much/any information behind these about the installation or controls. And these tend to look “peakier” and more “boiler-like” than what I’ve seen from OEM users and others posting about their high-performance installations.
@TrystanLea or @johncantor do you have thoughts on the pictures below based the data you’ve seen through the years? My theory is that high-performance, weather compensated installations might look somewhat different to these.
I can put together a few more thoughts on this later in the week and post for comment. Then maybe the next step is more discussion (or even a brainstorming zoom) on what are the most important aspects to start with / what would be a reasonable “minimum viable product.” Then could plan what makes sense to be within emoncms.org vs potentially on another platform. Happy to hear thoughts on process as well as on the dashboard idea!
I would be interesting at others thoughts on you graphs. I find it takes time to digest things, and feel that others are better at bigger-picture analysis… I tend to like zooming in on actual temperatures, power-input and heat-output over short periods. e.g. if it were car MPG tests, I would be looking at tyre pressures and filters and things. Between us, we should be able to draw some useful conclusions.
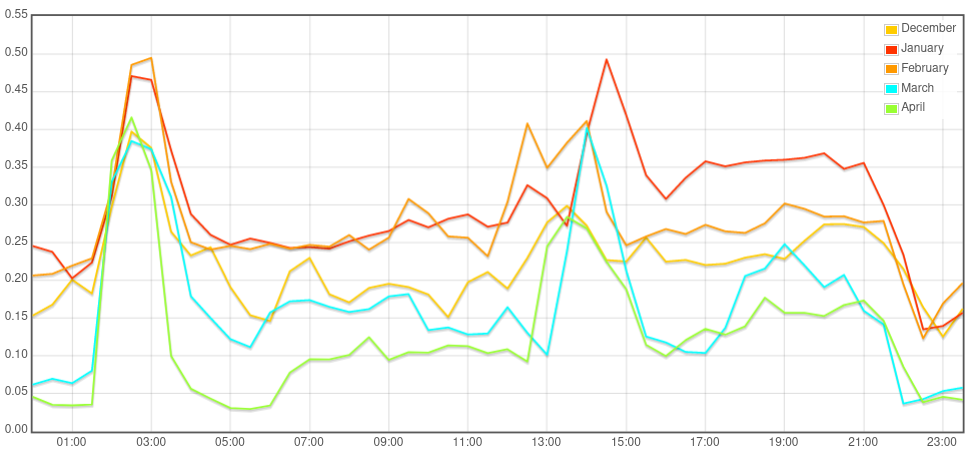
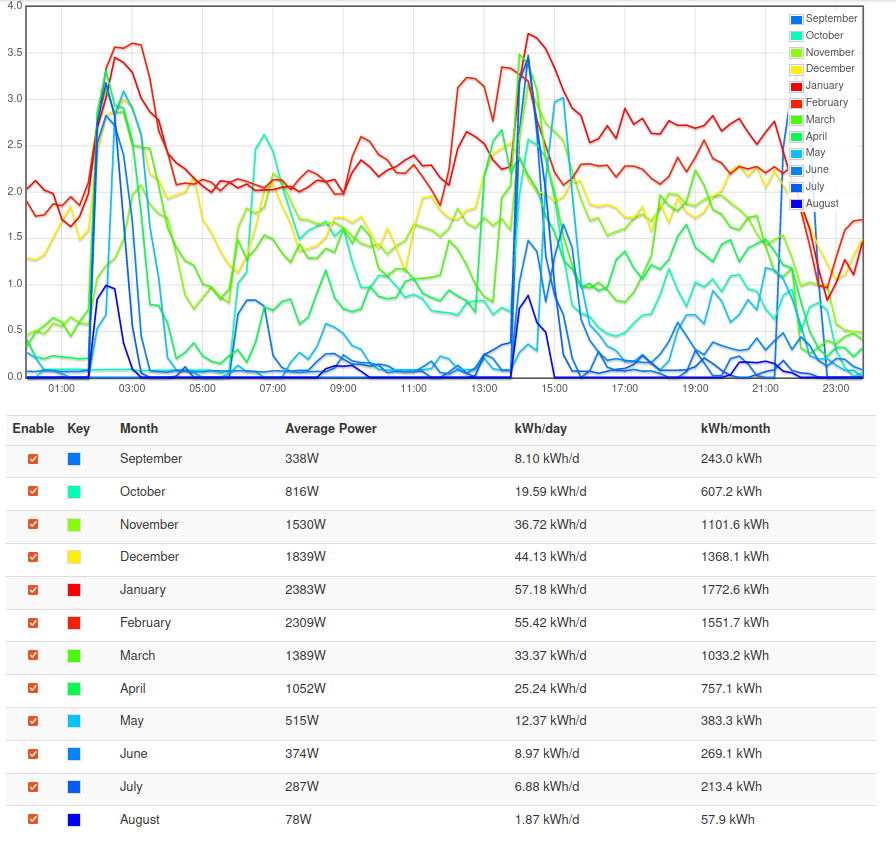
Thanks @frh really interesting to see those profiles, got me intrigued to see how mine looks, so started coding something up to do this. Here’s last winter Dec 21-> Apr 22:
It does look a lot smoother I guess. The spikes at 2-3am and 1-3pm is hot water heating. No morning heat up ramp and slightly more overnight except around 11pm…
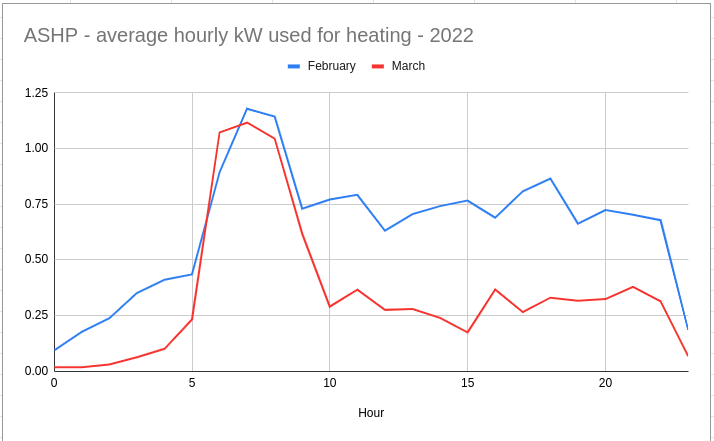
Here’s my hourly consumption* for heating only during February and March, showing ramp up in the morning then keeping level until it’s set back at 11pm.
*The original chart was showing kWh of produced heat - I don’t think the shape will change much between them.
This is certainly the kind of chart I’d like to see produced automatically, both for my own system and for an ‘average’ system for comparison.
Interesting to see @Timbones, quite a different shape again!
Ah I missed that, mine shows kW electric used as well. Seems like quite low amounts of heat producted then in the original graph…
I would like to do all that I can to help make a public dataset like this possible and don’t want the billing/account costs of emoncms.org to be a barrier. Id be happy at least for the first 20 users who wish to use emoncms.org to share ~8 feeds publicly for this dataset, for these feeds to be free. I think we’d be lucky to get to 20 users but if it does build into something larger this could be reviewed again in future, perhaps with free feeds if resolution is lower and data retention time shorter.
At the same time it would be good to avoid emoncms.org lock in. If we did put together a front end website that holds a leader board and contextual information about the systems it should be possible to implement in such a way that data could be pulled in from a variety of remote servers.
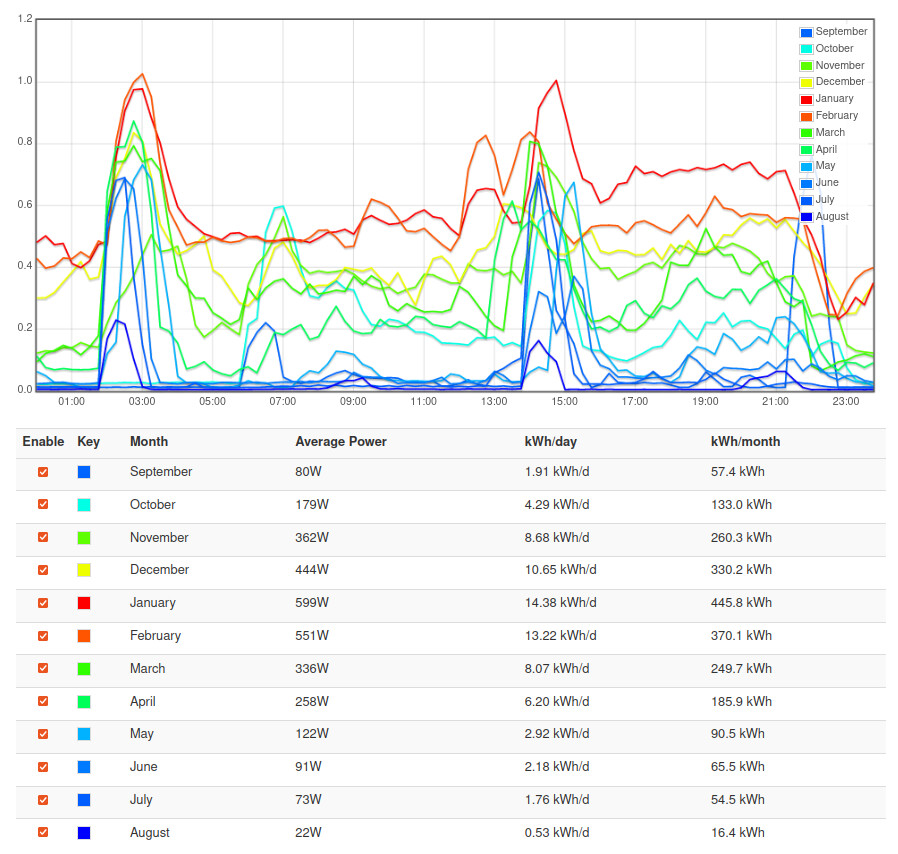
Nice plots @TrystanLea and @Timbones. The first plot looks like very low amounts of heat because it is averaged across lots of households which will have max demands at different times. Both of yours look generally flatter than the originals, but it may be that if 10-20 profiles were averaged together it would start to look like those pictures anyway. It’s December and January that seem flattest in Trystan’s plots, start to see a bit more ups and downs in Feb-April, I wonder if yours has the same Tim?
Your offer on billing costs is very kind Trystan! I wonder if we could get a small pilot version implemented whether it would be possible to get some funding support that might cover part of these costs. Something to consider as we go.
Hi all, I have just joined the platform as well as this conversation. I will know some of you on hear and some have been guests on the podcast (e.g. @johncantor)
I’ve mentioned to Trystan there is something being built which will do what you all want. From my stand point I’ve always though it a good idea where monitored systems can help engineers learn good practice and processes. I’ll hopefully be able to discuss more shortly and I’ll keep Trystan informed too
Yep. As @TrystanLea says, as part of my energy-stats umbrella of (hopefully) useful stuff i’ve created a cloud install of emoncms and will be pushing my sharky heat meter based data to it.
Plan is to make the emoncms heatpump app fully accessible to anyone that wants to play with the data. Custom URL, tweaked apache config, ssl etc, then the emoncms app embedded.
As my heat engineer and I have almost ticked every retro-fit requirement, we are hoping that the system will perform well when it gets installed in the next month or so.
Hopefully can dispel some myths about retrofit in a 1930s semi. Will be awful if it doesn’t perform like we hope though!! ![]()
It’s gonna be a 5kW Vaillant Arotherm Plus with a 250L Mixergy cylinder and Eddi… i’ve also got Solar, Zappi and Battery too.
I will also obviously contribute the data to this new project too.
I’ve been part of the PVouput solar website for almost 4 years now and all my generation/import/export data is up there. So I love the idea of aggregated data from lots of disparate system configurations.
One of the features of PVOutput is the ability to compare two systems directly. For example, weekly generation of Zarch vs mine - both are about the same size, similar location, but with different orientation.
It would nice to be able to do the same for heat pumps, though I suspect the variation will be much larger. Something else to add to our growing wishlist ![]()
Thanks @BetaTeach and thanks for signing up here!
@Zarch very much looking forward to seeing your data, I know it’s a lot of pressure for it all to work out… ![]() the combination of the heat pump and battery should be great for those profiles, allowing you to shift most of it offpeak I imagine! Great to see your PV output, it does highlight how good some of the PV output features are!
the combination of the heat pump and battery should be great for those profiles, allowing you to shift most of it offpeak I imagine! Great to see your PV output, it does highlight how good some of the PV output features are!
@Timbones really interesting to see that, yes very effective!
Thanks Nathan @BetaTeach for the info. It’s encouraging to hear others are already thinking about this. Do you have an idea of when you’ll be able to share more? How soon is “soon”? ![]()
I’ve written up a google doc trying to capture and organise the various ideas above. It should be editable. @TrystanLea and others please do add in your thoughts! Nathan it will be interesting to hear how similar the project you are involved with is, whether objectives are similar (I think so!) and whether there is potential for OEM data to be incorporated.
Hi Fiona, basically when Stream 2 is announced publicly. Are you guys Stream 1 or 2?
Thanks Nathan, we’re just doing this for fun ![]()
I realise I got my profile calculation above wrong and the half hourly electric average power’s are higher, here’s the corrected version (plus some more work on a profile app):
Electricity consumption (15min resolution)
Heat output (15min resolution)
Hi Fiona,
Not to bring doom and gloom to the document, but I’ve added a section at the bottom entitled ‘challenges’. ![]()
I know… and it looks like lot’s of fun too. I believe Fiona is part of a BEIS heat pump ready consortium. I am also in Stream 3 of the programme which was won by Carbon Trust… so you will all be able to hear lots about what is happening on the programme on special podcast episodes I will be doing for CT
Aha, great, well done Fiona @frh, look forward to hearing more about how these different initiatives progress! We have a few too many different things on in parallel to take part in a large grant funded project as a main partner at least, but great to see these initiatives happening!