Since getting the HP installed I’ve been able to read data from it via modbus which means that Samsung heatpumps can now be fully monitored without the need for expensive heat meters:
To my knowledge this is the only HP we’ve been able to get data from easily. I would recommend a Samsung HP if you’re interested in this sort of stuff. I’m also getting excellent performance.
It’s a shame that the modbus module goes into the outdoor unit rather than the control unit as it’s much harder to retrofit nicely now all our wiring/piping is in and watertight.
Agree, it’s a bit awkward to fit. Since you’ll need to run an additional cable into the house. However, the module fits in the wiring hatch near the top of the unit which is well away from all the pipework.
Congrats, Glyn, great video and really nice install - not least getting that thing up the tower and wall mounted!
Looking forward to seeing more data on this over the winter, and will be interesting to see how your solar and ASHP might work in conjunction together over the coming months.
Glyn, how accurate is the data from the Samsung control panel vrs your data? Do you know if the ‘Energy Generated’ is total heat output or output - electrical input?
Samsung measures the electricity use pretty accurately, although it doesn’t include the power used by the pump(s).
However, Samsung does a very poor job of measuring heat output. At least on my system, the heat output displayed by Samsung is 30% less than my heat meter. I think this is party down to Samsung assuming glycol is used (I’m not using glycol) and party due to the Samsung temperature underreporting the temperature of the flow/return. Samsung’s temperature measurements are about
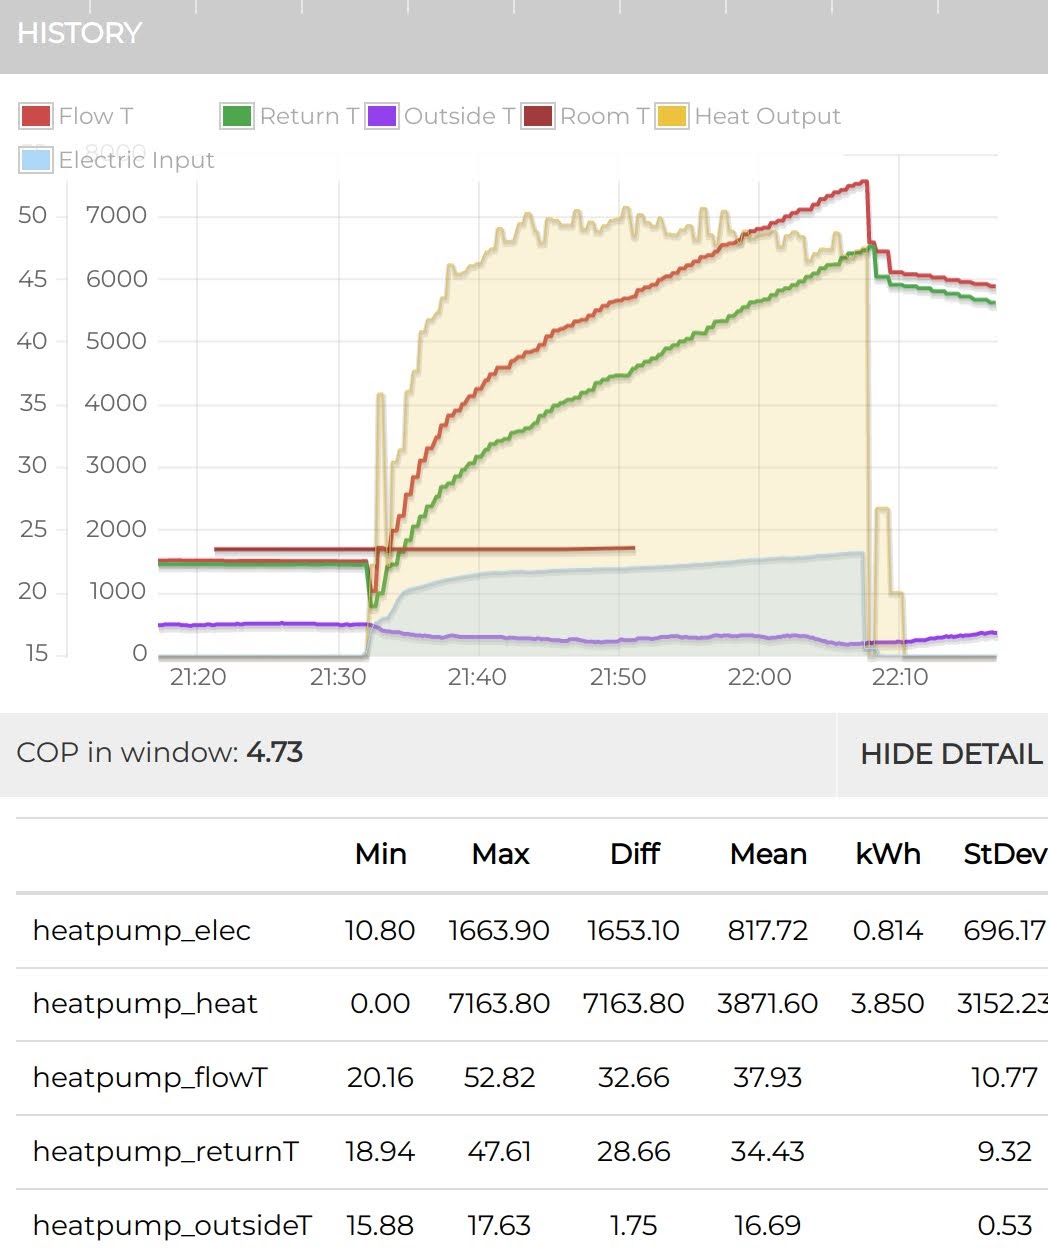
1° C below what my MID approved heat meter and my own digital DS18B20 sensors report. 1° C equates to about 1kW difference at a flow rate of 16.5L/min e.g yesterday Samsung reported 33kWh of heat while the heat meter reported 50.7kWh.
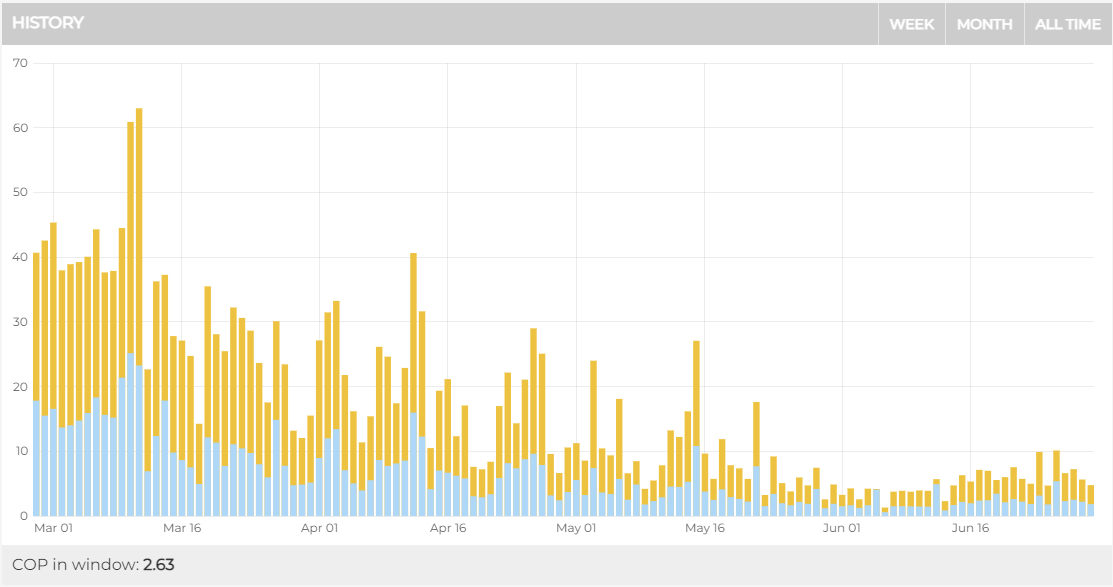
The result of this is that in December Samsung reported a COP of 2.9 while my MID approved heat and electricity meters reported a COP of 3.9.
I’m inclined to believe the readings from the MID approved meters, I’ve also double-checked the temperature readings from the heat meter which another set of independent sensors and confirmed that Samsung’s readings are wrong. What I’m not sure is do all Samsung ASHPs underreport heat deliverd? Or is it just my unit? It would be interesting to find another Samsung with a heat meter fitted to compare.
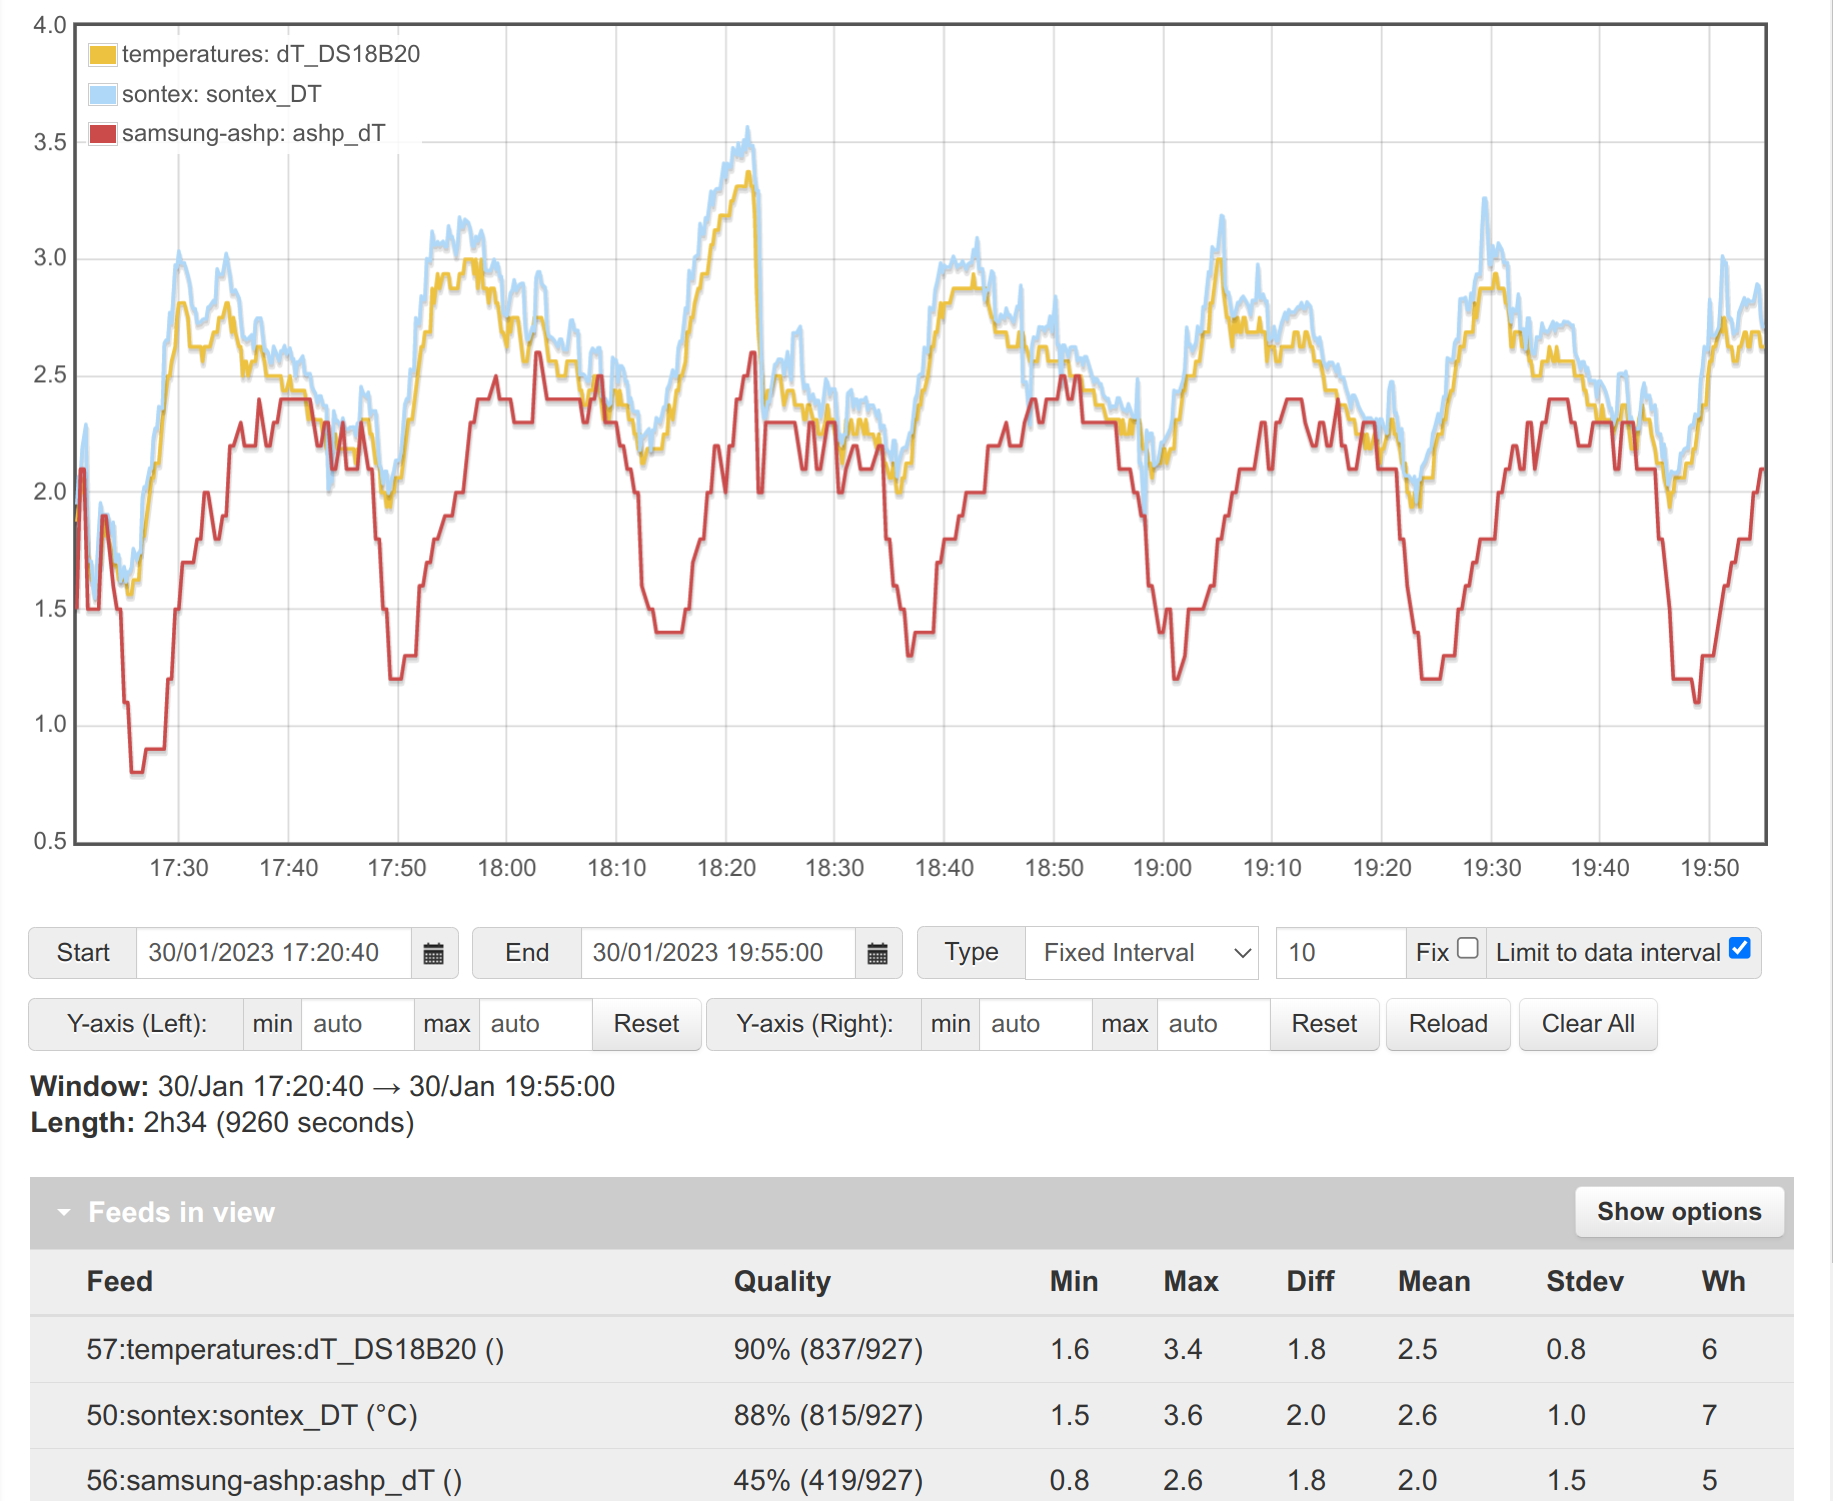
Here’s a graph comparing the dT between the Sontex (heat meter) temp sensors, some DS18B20 strap on digital temperature and the Samsung sensors as reported via Samsung modbus, as you can see the Samsung dT is significantly lower by an average of 0.5C:
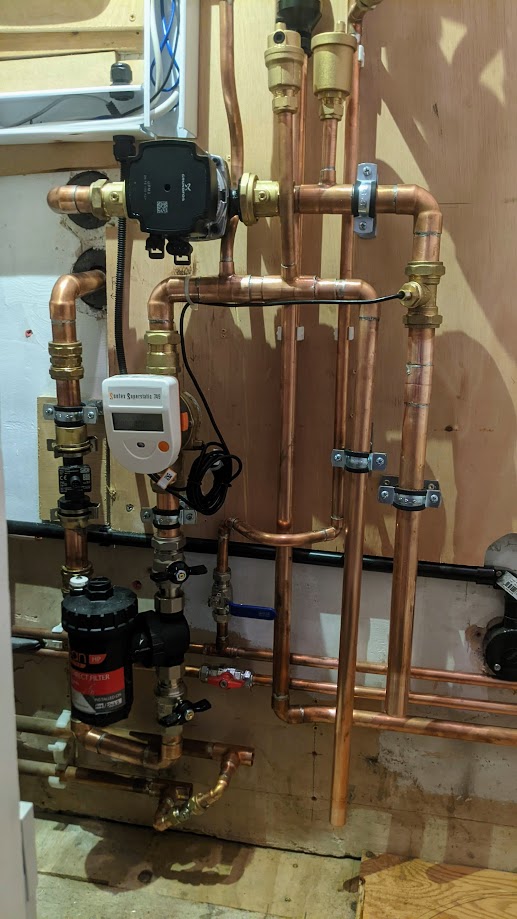
My guess is that Samsung’s sensors are negatively affected by the outdoor temperature, since they are strap on sensors located in the outdoor unit. The heat meter uses wet pocket sensors to accuracy measure the temperature of the water. Here’s a photo of one of the Samsung sensors inside my ASHP, this sensor is on the evaporator rather than the plate heat exchanger, but I’m guessing the other sensors are the same:
The glycol will be the main influence on energy here Materially lower heat capacity than water.
The heat meter temperature sensing is not accurate. It is very precise - the probes are a matched pair and the electical measurement technique ensures high repeatablility/precision - but it does not try to be accurate. The reasons for this are (a) it doesn’t matter for the purpose of measuring heat energy and (b) you can do lower power measurements if you care less for accuracy which is important on devices that need to run on a battery for 15 years.
Are you not on the refrigerant side here rather than the water side; so will also be seeing the approach temperatures across the heat exchangers here?
Hello Glyn,
I have just installed (yesterday) a 16kW Samsung Gen 6 unit and my early observations of CoP are similar to what you have observed i.e. 2.9 to 3 and I will monitor over the next week or so to confirm these results. I have also fitted anti-freeze valves - so no glycol.
I have also installed my unit with a 100 litre buffer tank and the effect has introduced a 2 degree step into the process, flow output temp is 38 degrees and input into the circ pump is 36 degrees, I know this temperature step will lower the overall efficiency and I need to measure the impact.
RJK
Thanks Glyn, that is very interesting to find out and puts the COP of my system in a very different light (I had also been calculating the COP from the Samsung data as Energy Generation/Energy Consumption).
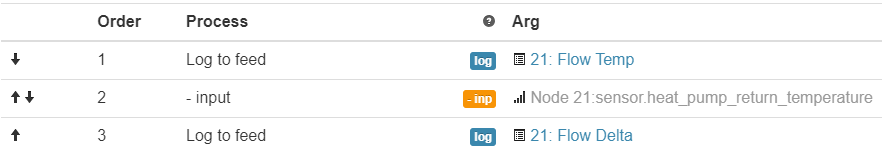
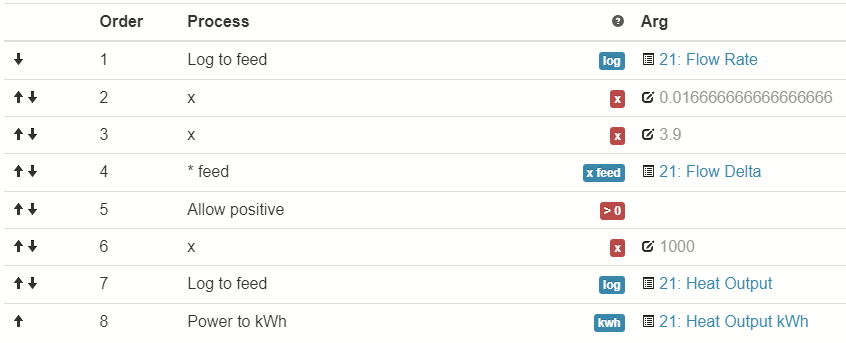
I wonder if you could give some advice on how to configure my emoncms.org inputs to get closer to the values obtained from the Samsung controller.