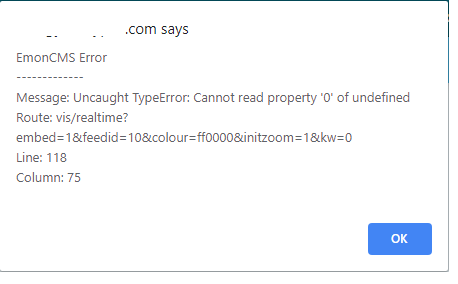
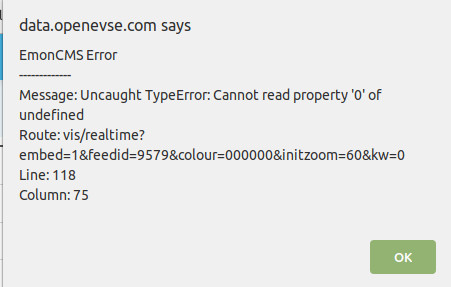
I have just noticed that on my dashboards, I have a slightly annoying issue with realtime visualisations when my devices have stopped sending data. The realtime graphs all throw ‘Uncaught typeerror: Cannot read property ‘0’ of undefined’ in succession. When the devices are sending data - everything works okay. But I have some cases where they won’t be on all the time, and this breaks the usability of the dashboard.
Is this known behaviour, or have I done something wrong?
Can you click on the button Copy as Markdown next to Server Information on the Admin page and paste into a reply here please (no further formatting required).
Hi @nickthesloth,
We’ve corrected the issue and merged it into the the EmonCMS “master” branch we use for testing.
The master branch will be merged into the “stable” branch at the next release. Once this happens your EmonCMS install can be updated via EmonCMS->Admin->Update.
That was quick I will keep a look out for the new release!
Re. the multigraph and floating time - I do use that too, though what drew me to the ‘realtime’ graphing was the short time period of its nature.
While I’m here - could I ask, is there a simple way to set the multigraphs to display perhaps the last x hours in time on loading the dashboard? The smallest period of time I seem to be able to easily pick is the D/W/M etc controls. Not the end of the world if not!
Hello Nick, yes, if you select the range you wish to see e.g last few hours and select that period up to the present moment, then enable floating time, it should work and keep updating for the period of time selected.
 and certainly - here it is: