Hi, I am running several emonTX’s and since I updated to the latest firmware my graphs are no longer getting data. Inputs & Feeds all okay and all services in the Admin section are running. Can anyone help me with this ?
Do you mean you updated the ‘firmware’ on the emonTXs (requires plugging in a programmer) or updating the EmonCMS web based software?
Hi Brian, I updated the EmonCMS web based software.
Ok thanks.
Does the ‘Feeds’ page show that the feeds have been updated recently?
Are you logged in (try and log out and log back in)?
The feeds are updating constantly, I tried logging in / out before but it is still the same.
Do you have SSH access?
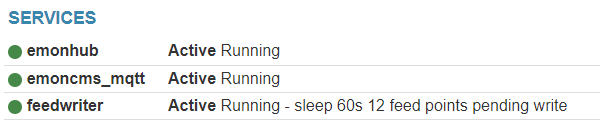
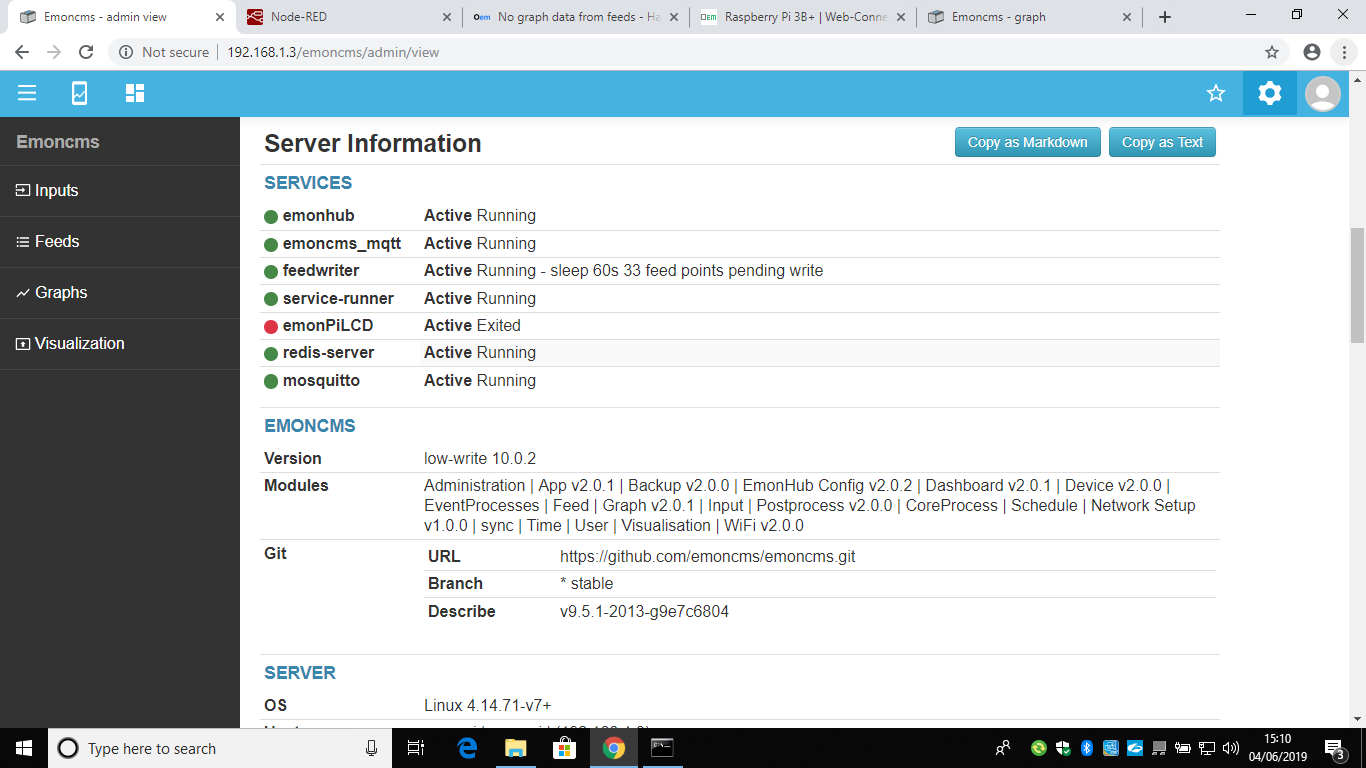
Can you check Feedwriter is running please. From the admin screen it should look like this;
If you have SSH access try
sudo systemctl restart feedwriter.service
systemctl status feedwriter.service
and post the output.
After this check and see if the graphs are now updating.
1 Like
The Feedwriter is running and the services look the same as your post, only difference is 36 feed points pending write. I am not familiar with SSH so don’t know how to access it. I have EmonTX’s V3 running off a Raspberry PI base station they have no screens on them.
Is it an EmonPi or the bare Raspberry Pi?
Does it say ‘sleep 60s’ or ‘sleep 600s’?
Are the graphs updating at all or is the data just delayed?
Its a bare Raspberry Pi,
It says " sleep 60s "
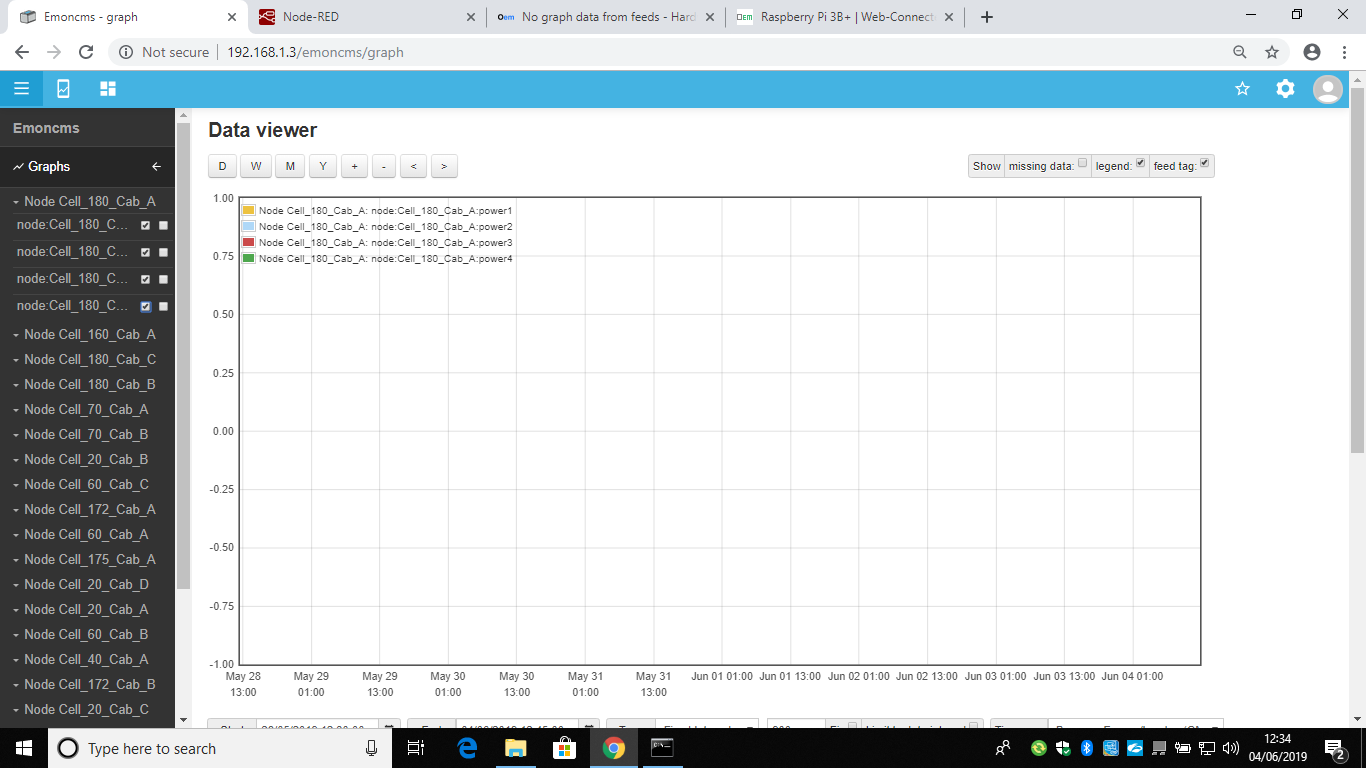
The graphs are not up dating, when I click on the feed to go to the graph there is nothing there, graphs are just blank even when I tick other feeds on the graphs.
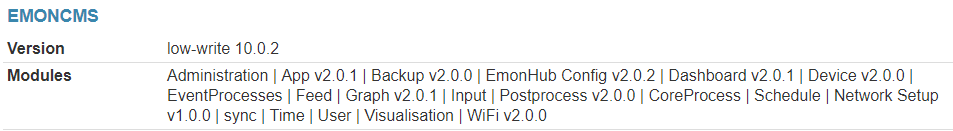
First, on the Admin page, can you check the graph module version please (in case it has not updated for some reason)
Secondly, could you clear your browser cache and/or try the graph in a private window please.
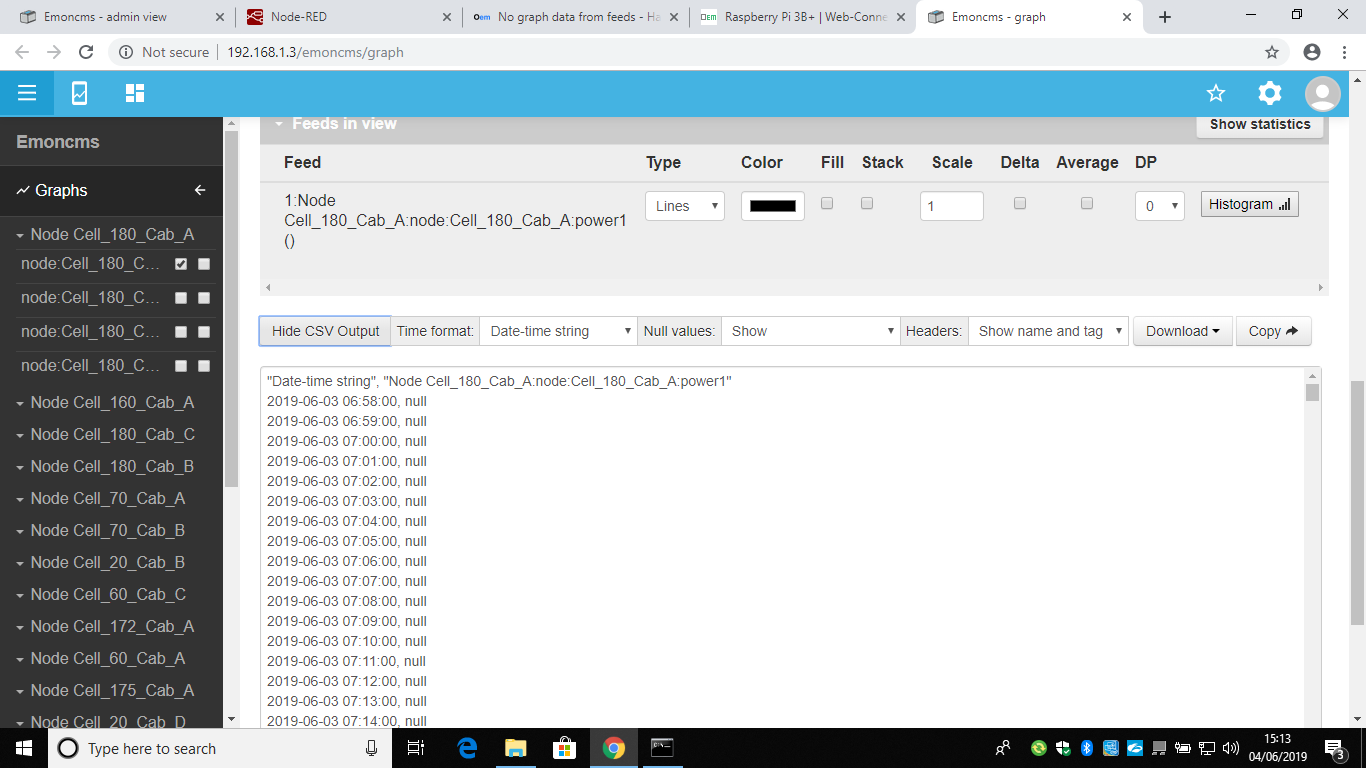
Finally, at the bottom of the page is a ‘show csv’ button. If you zoom in to a day view then click on that button, what data is returned?
The version looks the same
I have cleared the cache and open the graphs in a new window and this is what it shows
Hi thanks for your help, I have discovered the solution, I have deleted the feeds and added them back in one by one and the graphs are now showing. Not sure why the graphs stopped working but it must have happened when I did the firmware update and imported my update.
All working now, cheers 
1 Like