Thanks to all for making this new EmonTx4 available, and for getting the production units out the door so quick. Mine arrived yesterday and is now providing basic monitoring of the heat pump. Very pleased that all the wired DS18B20 sensors were reading exactly the same, which means I only have to calibrate them to the Vaillant flow temp now. One interesting issue I still have to solve is that the resulting feeds in EMONCMS have plenty of lost data, with different feeds having different lost data (so not just a packet loss issue). I’m beginning to suspect the old Pi 2-based EmonPi is struggling with all the RF data feeds!
Possibly you are suffering from RF interference.
Could you plug the emonTX4 into the EmonPi directly?
You are probably right. I have Emontx3 and 5 Emonth units as well, and all have frequent data gaps, although the gaps are not synchronous across devices. However, suspiciously, there is nearly always a gap in the Tx4 and Tx3 feeds on the hour.
Unfortunately I can’t currently use a direct connection.
There has to be something else going on to. I’ve got three DS18B20, 1 50amp and 1 20amp sensor. All but the 50amp (ct3) have the same data gaps on their feeds, but the feed for ct3 has much more data missing. If I watch the inputs from the Tx4, they all update concurrently, except very rarely there may be a few that get 3sec out of sync. There are “red” intervals for the device which probably correspond to the interference.
I’ll post image tomorrow!
Analyse the emonhub log. Check and see if the data is being received and sent OK.
Then check the Emocms log and match the date stamps between them, and see if there are any anomolies.
Both logs on DEBUG. journalctl or tail and egrep are useful tools to filter the logs.
If you are sending each sensor as a separate MQTT topic, I have seen the MQTT input script to Emoncms max out and miss data.
The inputs page doesn’t tell you very much at all (except there are gaps).
It would be interesting to see that. One option will be to upgrade all the firmware on the nodes to the new LowPowerLabs radio format with message acknowledgments and retries (once that’s available for all the devices that you have). I sill need to do the EmonPI and emonTx3 firmware variants with this option.
I’ve spent a fair bit of today moving the EmonPi into direct line of sight with both the EmonTx4 and Tx3. This made no difference to the lost data, nor did shuting down the Tx3. So I suspect that there is interference. As this EmonPi and EmonTX ran flawlessly under a very similar 433MHz environment in our old property (although under a much older version of the software), I suspect that this narrows the possibility of what is causing interference to the SmartMeter, a myEnergi harvi/zappi2/hub (866MHz, I think), one wireless alarm sensor or something in the solar invertor, Powerwall or gateway generating noise. I’ve run EMONhub with quiet=false and there are a number of unreliable packets, although the content of them superficially looks “as expected” (I’m sitting down shortly to look further on this)
So here is the promised image.
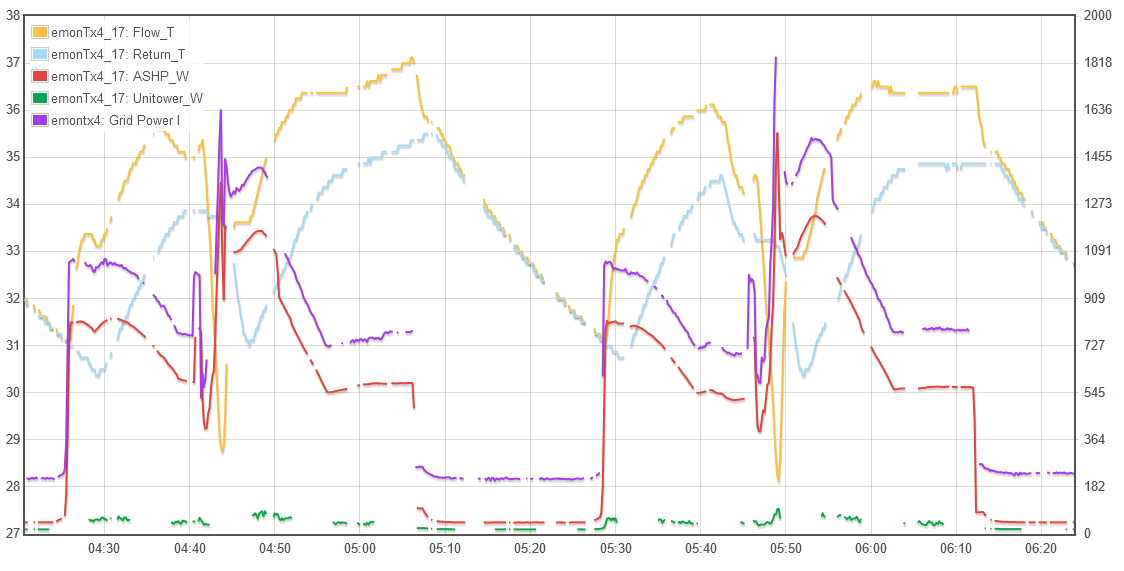
- Tx4_17 Flow_T, Return_T and ASHP_W are unprocessed, logged feeds. ASHP is a 20amp CT (CT4). All drop out at the same time.
- Tx4_17 Unitower_W is an unprocessed, logged feed from 50amp CT (CT3). This drops out at the same time as the others, but is missing a lot more often. My brief look at the Emonhub.log (and the Input view updates) shows that this is not because of an issue with missing data in the received packet.
- Tx4 Grid Power I is unprocessed, logged feed from EmonTX3 100ampCT. Some drop outs are synchronous with those on the EmonTx4, but not all.
- I get a distinct feeling that the dropouts are periodic, although not precisely so.
@TrystanLea I should be happy to try the new firmware once available: thanks for progressing this.
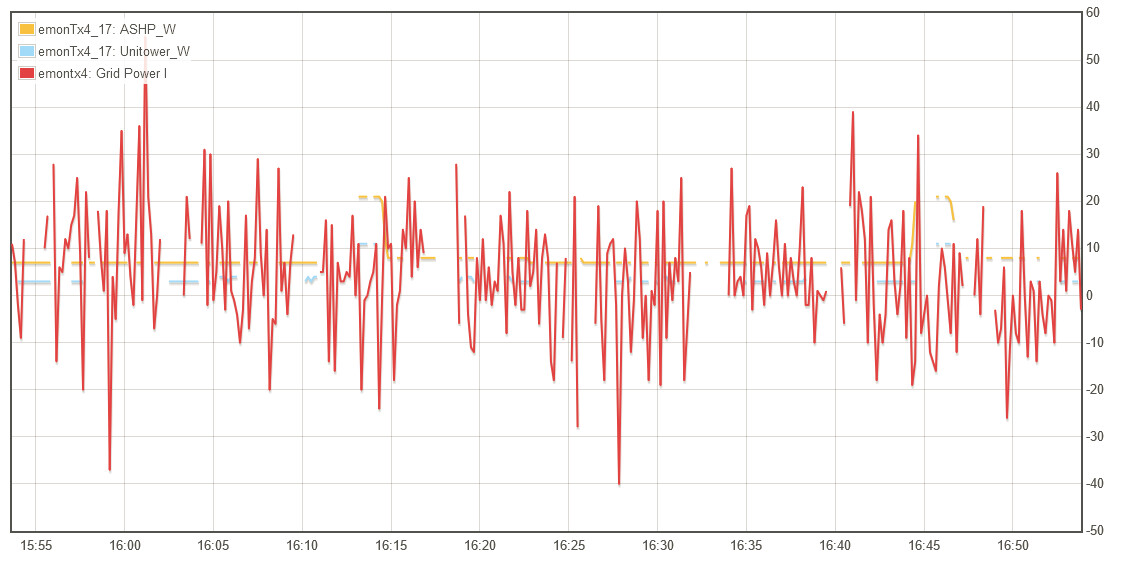
Just to show how much better the Tx4 power readings are, I thought I’d add this image for the last hour when the Tx3 100amp CT has been reading all over the place on a zero W circuit (battery providing all power as it has been sunny!)
So the Emonhub.log shows that the data drop outs correspond to receipt of ill-formed packets or complete absence of packets, so I’ll have to work out how to investigate RF noise!
However, the log also shows that the EmonTx4 packets are fully formed and are publishing as expected. Below is a log excerpt for the packet that relates to the labelled time in the following graph.
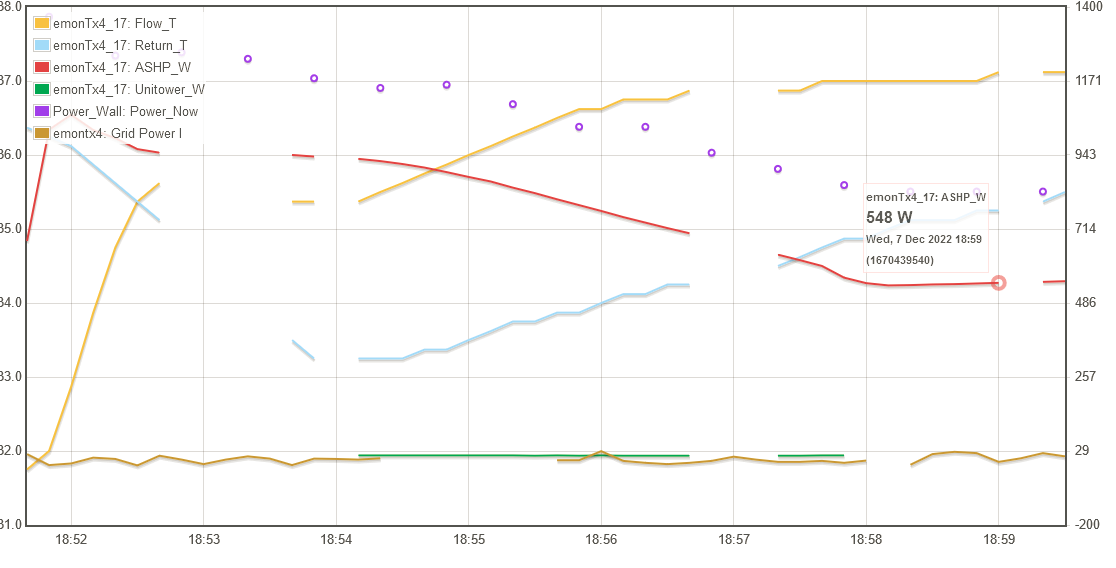
I’ve marked in bold the data that is getting to the feeds correctly and in bold italic the P3 value that should be getting to the emonTx4_17: Unitower_W feed.
2022-12-07 18:59:07,599 DEBUG RFM2Pi 6823 NEW FRAME : OK 17 71 43 0 0 255 95 0 0 0 0 14 0 36 2 0 0 3 0 234 0 0 0 117 0 0 0 183 3 0 0 254 46 0 0 48 0 0 0 85 0 0 0 128 14 197 13 8 9 0 0 0 0 (-64)
2022-12-07 18:59:07,604 DEBUG RFM2Pi 6823 Timestamp : 1670439547.598869
2022-12-07 18:59:07,605 DEBUG RFM2Pi 6823 From Node : 17
2022-12-07 18:59:07,606 DEBUG RFM2Pi 6823 Values : [11079, 245.75, 0, 0, 14, 548, 0, 3, 234, 117, 951, 12030, 48, 85, 37.12, 35.25, 23.12, 0, 448, 27.620221948212084]
2022-12-07 18:59:07,607 DEBUG RFM2Pi 6823 RSSI : -64
2022-12-07 18:59:07,607 DEBUG RFM2Pi 6823 Sent to channel(start)’ : ToEmonCMS
2022-12-07 18:59:07,608 DEBUG RFM2Pi 6823 Sent to channel(end)’ : ToEmonCMS
2022-12-07 18:59:07,750 DEBUG MQTT Publishing: emon/emonTx4_17/MSG 11079
2022-12-07 18:59:07,752 DEBUG MQTT Publishing: emon/emonTx4_17/Vrms 245.75
2022-12-07 18:59:07,754 DEBUG MQTT Publishing: emon/emonTx4_17/P1 0
2022-12-07 18:59:07,756 DEBUG MQTT Publishing: emon/emonTx4_17/P2 0
2022-12-07 18:59:07,758 DEBUG MQTT Publishing: emon/emonTx4_17/P3 14
2022-12-07 18:59:07,760 DEBUG MQTT Publishing: emon/emonTx4_17/P4 548
2022-12-07 18:59:07,761 DEBUG MQTT Publishing: emon/emonTx4_17/P5 0
2022-12-07 18:59:07,763 DEBUG MQTT Publishing: emon/emonTx4_17/P6 3
2022-12-07 18:59:07,764 DEBUG MQTT Publishing: emon/emonTx4_17/E1 234
2022-12-07 18:59:07,766 DEBUG MQTT Publishing: emon/emonTx4_17/E2 117
2022-12-07 18:59:07,768 DEBUG MQTT Publishing: emon/emonTx4_17/E3 951
2022-12-07 18:59:07,770 DEBUG MQTT Publishing: emon/emonTx4_17/E4 12030
2022-12-07 18:59:07,771 DEBUG MQTT Publishing: emon/emonTx4_17/E5 48
2022-12-07 18:59:07,773 DEBUG MQTT Publishing: emon/emonTx4_17/E6 85
2022-12-07 18:59:07,775 DEBUG MQTT Publishing: emon/emonTx4_17/T1 37.12
2022-12-07 18:59:07,776 DEBUG MQTT Publishing: emon/emonTx4_17/T2 35.25
2022-12-07 18:59:07,778 DEBUG MQTT Publishing: emon/emonTx4_17/T3 23.12
2022-12-07 18:59:07,780 DEBUG MQTT Publishing: emon/emonTx4_17/pulse 0
2022-12-07 18:59:07,781 DEBUG MQTT Publishing: emon/emonTx4_17/missed 448
2022-12-07 18:59:07,783 DEBUG MQTT Publishing: emon/emonTx4_17/missedprc 27.620221948212084
2022-12-07 18:59:07,785 DEBUG MQTT Publishing: emon/emonTx4_17/rssi -64
2022-12-07 18:59:07,786 INFO MQTT Publishing ‘node’ formatted msg
2022-12-07 18:59:07,787 DEBUG MQTT Publishing: emonhub/rx/17/values 11079,245.75,0,0,14,548,0,3,234,117,951,12030,48,85,37.12,35.25,23.12,0,448,27.620221948212084,-64
At this point, I am in too deep for my current level of knowledge, so any guidance would be much appreciated.
(as an aside, the data shown on the graph as dots is a feed populated by inputs generated by the excellent Powerwall script by @johnbanks using a default 30 second loop. I’ve never understood why these data cannot be visualised as “lines” in the web graph interface. They appear as lines in the webapp feeds graphs.)
Re the PowerWall power being shown as points - you could try this …
In Data Viewer, scroll towards the bottom of the screen then for yr feed Power_Wall Power_Now select “Lines” in the Type drop down
Have you chcked that the Feed Intervals are appropriate to the rate at which data arrives in emonHub - emonCMS? The Feed Interval should ideally be slightly longer than the time between the consecutive data values destined for that feed.
1 Like
Has it ever run well before the TX4 was added? If not, it isn’t a TX4 issue.
I suspect you will need to a Wi-Fi based collection of data from the TXs
Thanks @AndyS just to check i understand correctly, you currently have the following hardware:
- emonPi, do you have any CT sensors, temperature, pulse connected?
- emonTx3
- emonTx4
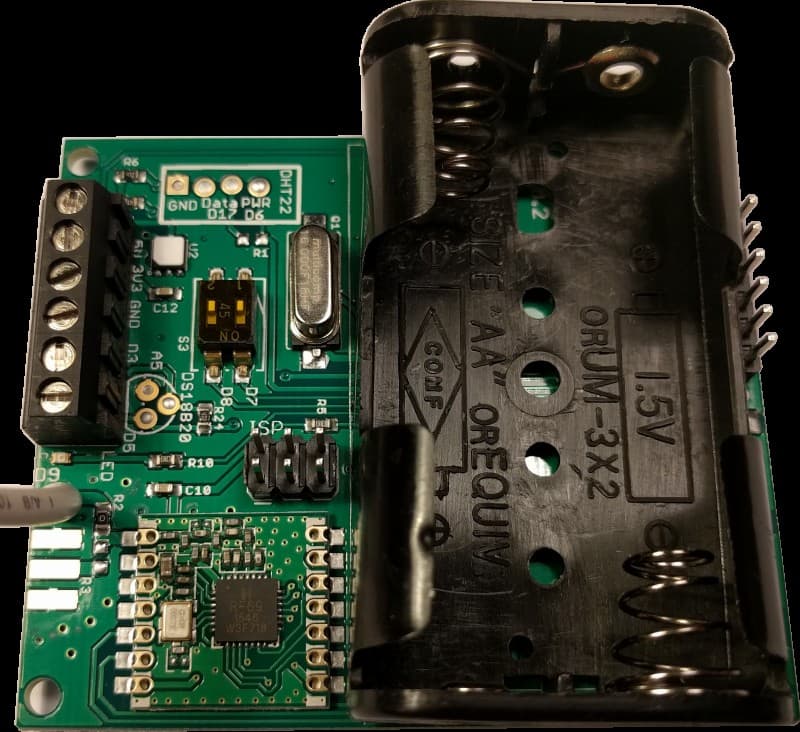
- 5x emonTH, are these version 2 I wonder? Does it have the SI7021 chip top-left small white square near the terminal block:
It sounds to me like interference, especially with the packet corruption issue, though it could be something else. Can you try a process of elimination to see if turning off some nodes and other equipment makes any noticeable difference?
It would be worth double checking this, if you hover over each feed in the feeds list, emonTx3 & 4 feeds should have an interval of 10s, and emonTH feeds 60s
I’ve updated the thread title to better reflect it is not an emonTX4 issue specifically.
Thanks John. That is the default and displays nothing: I can only get data displayed as points.
In another property without the 5 emonth nodes, yes. Here, with the additional nodes, apparently not although I did not notice this until the EmonTx4 went in.
Thanks Robert. The intervals should all have been 10sec in the feeds for the EmonTx4, but I had somehow misconfigured the P3 feed so that it was 5 secs (my bad: @TrystanLea this explains the feed not populating). I added further 15 sec feeds for the power sensors but there is no difference between the data graphed for these feeds versus the 10 sec feeds, including when Tx4 is the only node sending RF. With display mode set to “points” I note that the points displayed are at the fixed interval set on the graph, rather than at the feed interval. As an aside, I have checked that the flashes on the tx4 do occur at 9.8secs.
I noted that I had tried that yesterday by turning off EmonTx3 which has most sensors and for which there is a lot of feed processing. It made no difference. I dropped out all bar the EmonTx4 today and do not see a noticeably different pattern to drop outs. I’ve also disabled all the other possible RF 433MHz sources that I can, again with no apparent impact.
Kit here is
- EmonPi (Pi 2 Model B) with 1 DS18B20 and voltage monitor (ethernet connected)
- EmonTx4 running in compatibility RF mode with EmonVs PSU, 3 DS18B20, P3=50amp and P4=20amp CTs
- EmonTx3 (2016 vintage). Voltage sensor, 4*100amp CTs, 1DS18B20
- 5 EmonTh v2
- Powerwall feed via service (c.f. John’s script)
Powerwall feeds are 30sec, all temp feeds are 1 min and the rest are 10sec.
With all the nodes off, there are still a lot of discarded packets, so I guess there is something else on the 433MHz band. Given the apparent periodicity of the dropouts, my finger is currently pointing at the SMETS 2 Smart meter. We have bad 2G/3G/4G coverage here and the installer needed to use MESH mode. I think this is 869MHz in our area? There is certainly a large aerial of exactly the right length for a 869MHz monopole (or 433MHz dipole depending on internal connection!). The Zigbee HAN is very low power and the internal unit has to be within line of sight of the cabinet: turning it off does not impact the dropouts.
Thanks for everyone’s guidance (and patience!). As per Brian’s comment I shall have to consider the hardware options.
1 Like
In yr log to feed, are you using Emoncms Fixed Interval TimeSeries?
Great thanks for the update on that. At least that rules out some kind of mid packet corruption that should really have been filtered out by the CRC check anyway.
It would be interesting to see how effective the LowPowerLabs format acknowledgement and retry mechanism is at reducing the packet loss in your case, perhaps if there is too much interference it will not be enough and will just result in further issues as all the notes attempt their own retries, on the other hand it might be fine and sort your issue…
I will let you know as soon as the firmwares for that are available.
Is the emonTx3 within direct cable distance to the emonPi?
Longer term I want to switch to a mechanism that allows the emonPi/base to request data from each node in sequence or send out a timing broadcast. This should allow accomodation of a much greater number of nodes with much lower probability of collisions - at least between OpenEnergyMonitor nodes. Doesnt help much against interference from 3rd party equipment but perhaps if coupled with the acknowledgment and retry mechanism would end up being sufficiently robust.
Yes, and I think this is a feed versus input frequency issue. The feeds are 10 sec intervals. I’m learning a lot just now. Thanks for your input.
1 Like
Thanks, I’ll look forward to trying it. At present the EmonTx3 is not close to the EmonPi. I’m going to think about alternative configurations for the EmonPi, the EmonTx3 and EmonTx4 which might make direct connections possible. That would involve getting some more of the new CT clamps, a couple more EmonTHs and +/- a ESP8266 WiFi adaptor and an extra socket wired in. I have to balance that against waiting for the ebus Adaptor 3 or going the whole hog and retrofitting a heatmeter!