Hopefully a fairly easy one. If you have multiple arrays on separate inverters, what is the best way to log the separate CT sensors to provide daily bar charts of kWh for each array (which I have already) and also of the total generation per day?
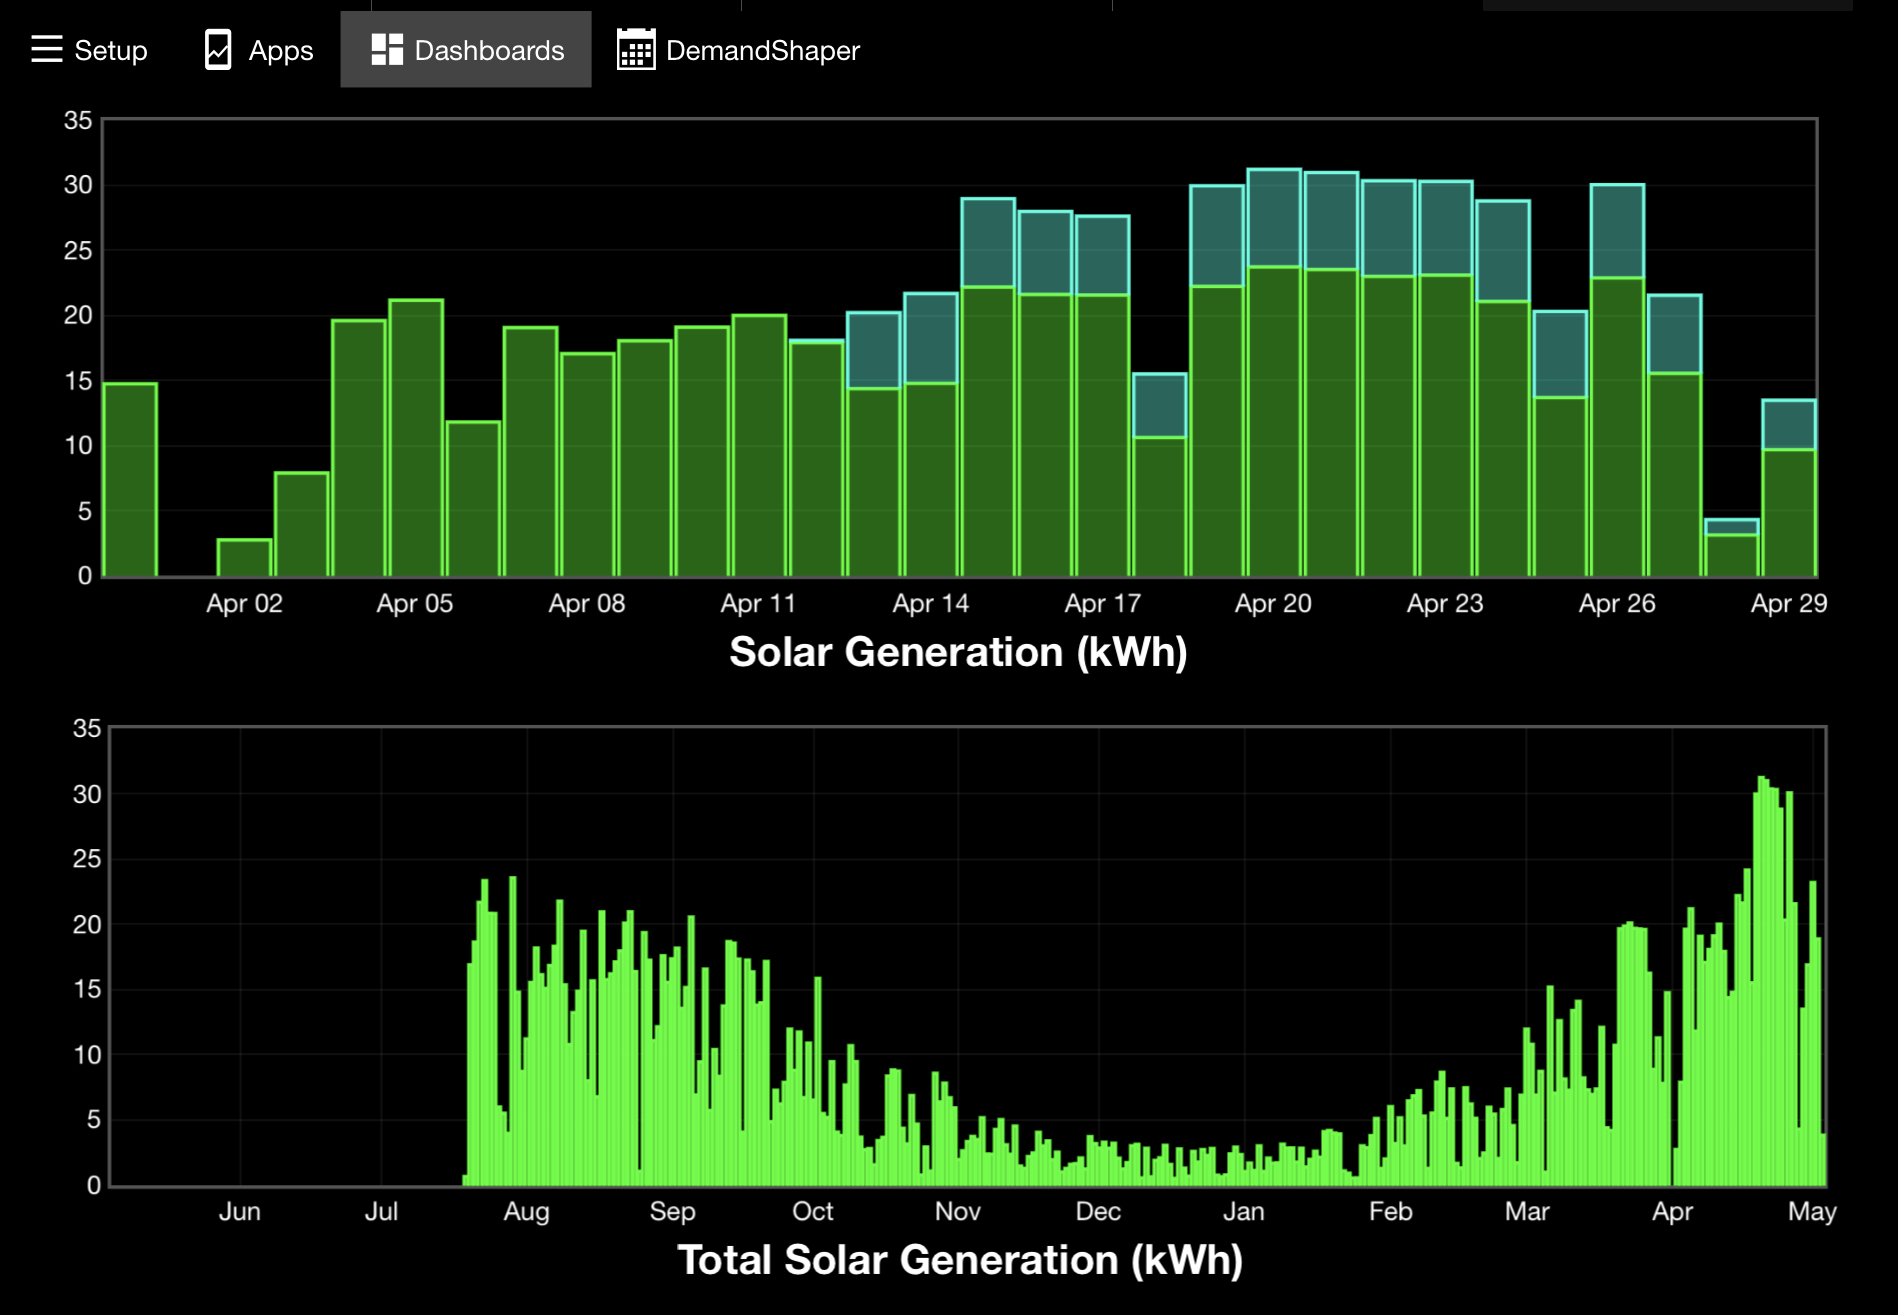
Thanks Robert. Grafana looks interesting. My solution was to create a new PHPTIMESERIES feed of array 1 + array 2. I then replaced the newly created data file with a copy of the file for array 1 so that it was preloaded with my historical data from before array 2 was installed. Now it can go forward collecting the total solar generation. The result continues what is a pleasing graph and will look great by the end of the summer I predict.
Stacked solar is also a really good graph, but it serves a slightly different purpose.